Open Access
Fig. C.5
Download original image
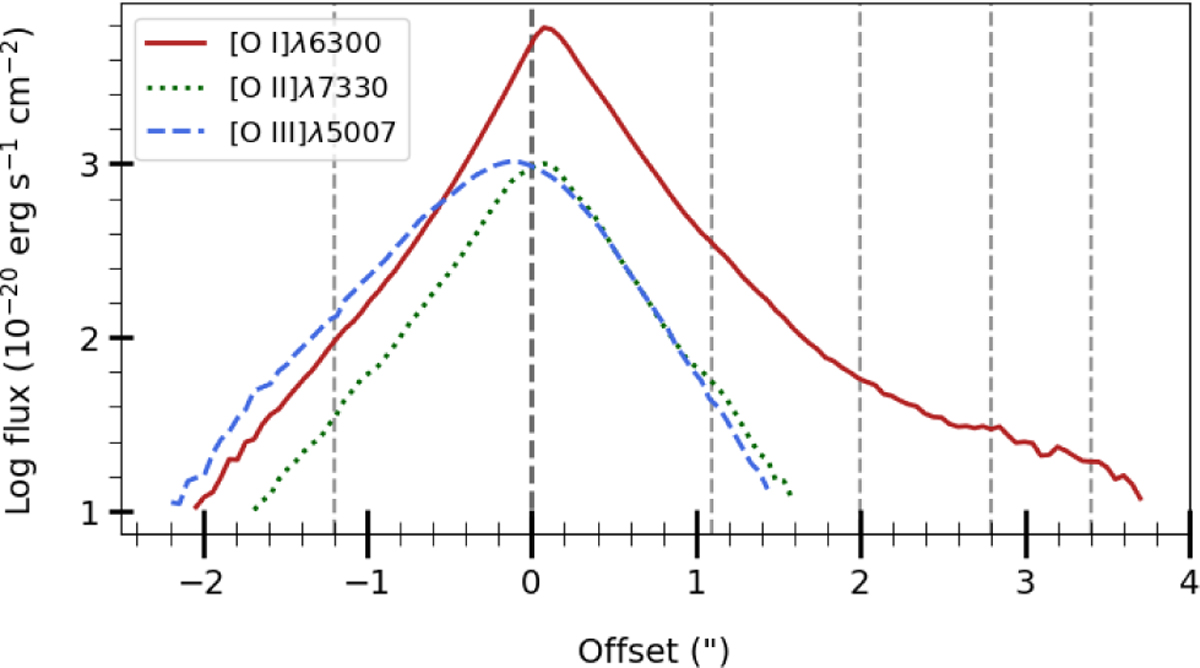
Flux profiles of the [O I]λ6300, [O II]λ7330 and [O III]λ5007 lines along the jet axis. Profiles are shown without scattered emission subtraction. Vertical dashed lines indicate the source position (black) and the approximate knot positions (grey).
Current usage metrics show cumulative count of Article Views (full-text article views including HTML views, PDF and ePub downloads, according to the available data) and Abstracts Views on Vision4Press platform.
Data correspond to usage on the plateform after 2015. The current usage metrics is available 48-96 hours after online publication and is updated daily on week days.
Initial download of the metrics may take a while.