Open Access
Fig. C.7
Download original image
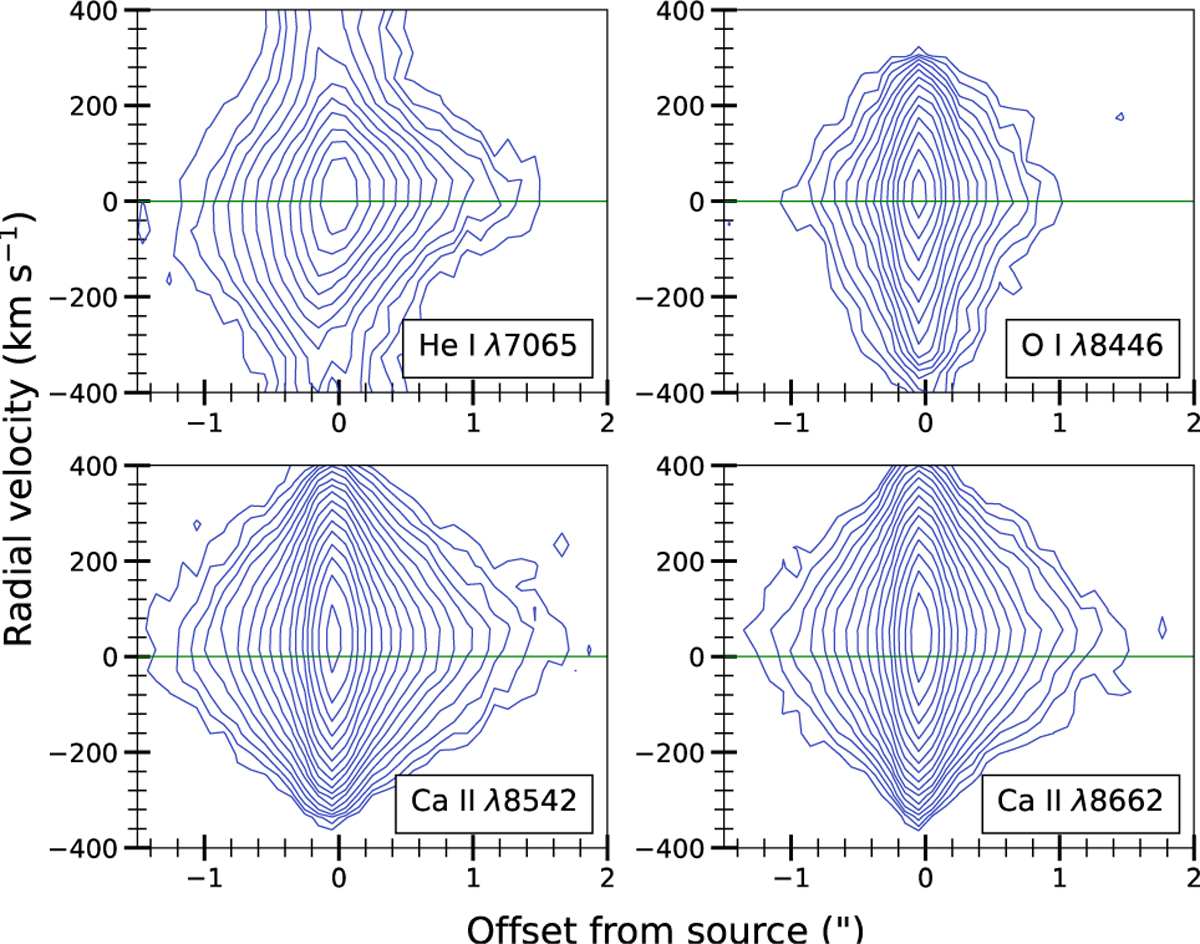
Position-velocity maps for the accretion-tracing lines sampled in Fig. C.6. Contours start at 3σ of the background level (4 × 10⁻¹⁹ × erg s−1 cm−2) and scale as factors of √2.
Current usage metrics show cumulative count of Article Views (full-text article views including HTML views, PDF and ePub downloads, according to the available data) and Abstracts Views on Vision4Press platform.
Data correspond to usage on the plateform after 2015. The current usage metrics is available 48-96 hours after online publication and is updated daily on week days.
Initial download of the metrics may take a while.