Fig. 4
Download original image
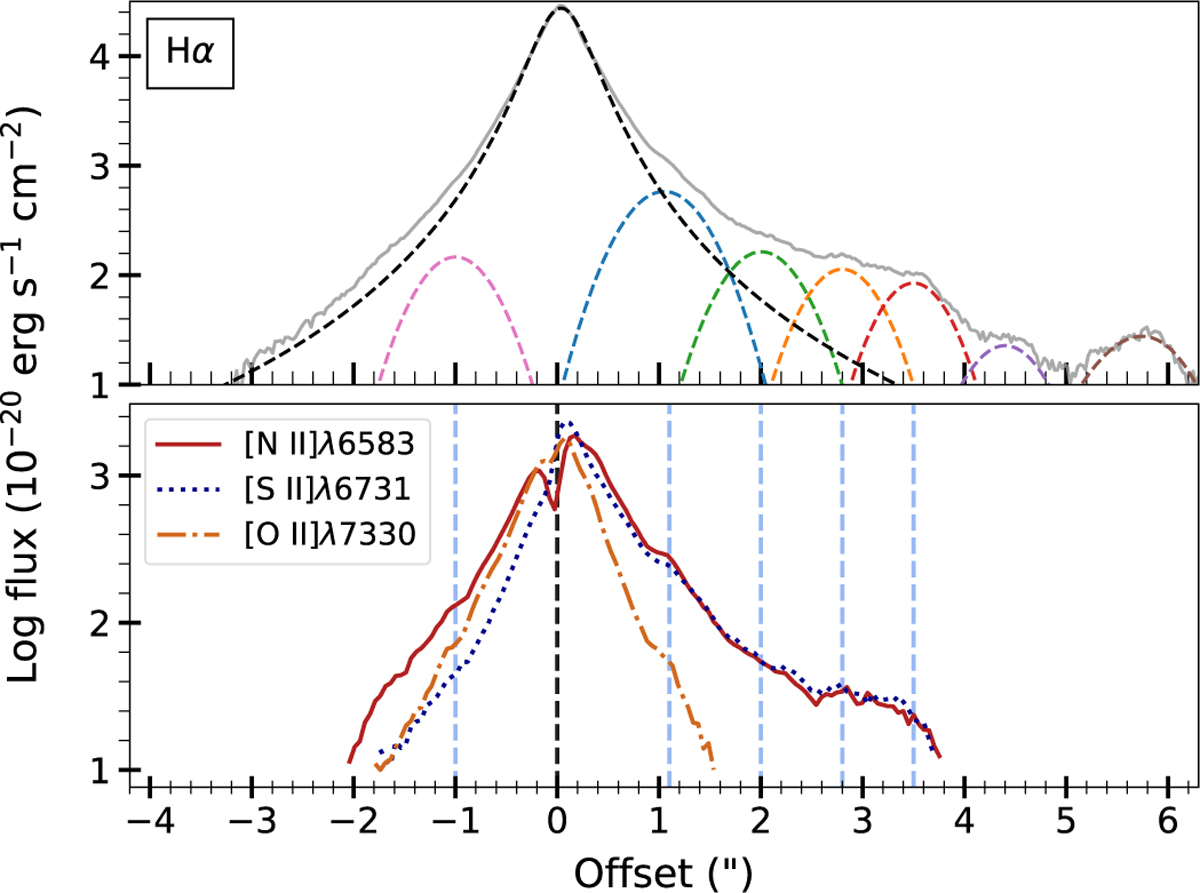
Selected flux profiles along the jet axis in the full mosaic (without deconvolution). Top panel: Hα profile (grey) without scattered emission subtraction showing the components of the fitted model. The line emission at the source peak was fitted with a Moffat function (dashed black line), and knot peaks were fitted with Gaussian profiles (dashed coloured lines). Lower panels: flux profiles in three key FELs after scattered emission subtraction (see Appendix A). The tentative and detected knot centres are marked with vertical blue lines, showing their correspondence to the features in the FEL profiles.
Current usage metrics show cumulative count of Article Views (full-text article views including HTML views, PDF and ePub downloads, according to the available data) and Abstracts Views on Vision4Press platform.
Data correspond to usage on the plateform after 2015. The current usage metrics is available 48-96 hours after online publication and is updated daily on week days.
Initial download of the metrics may take a while.