Fig. 7
Download original image
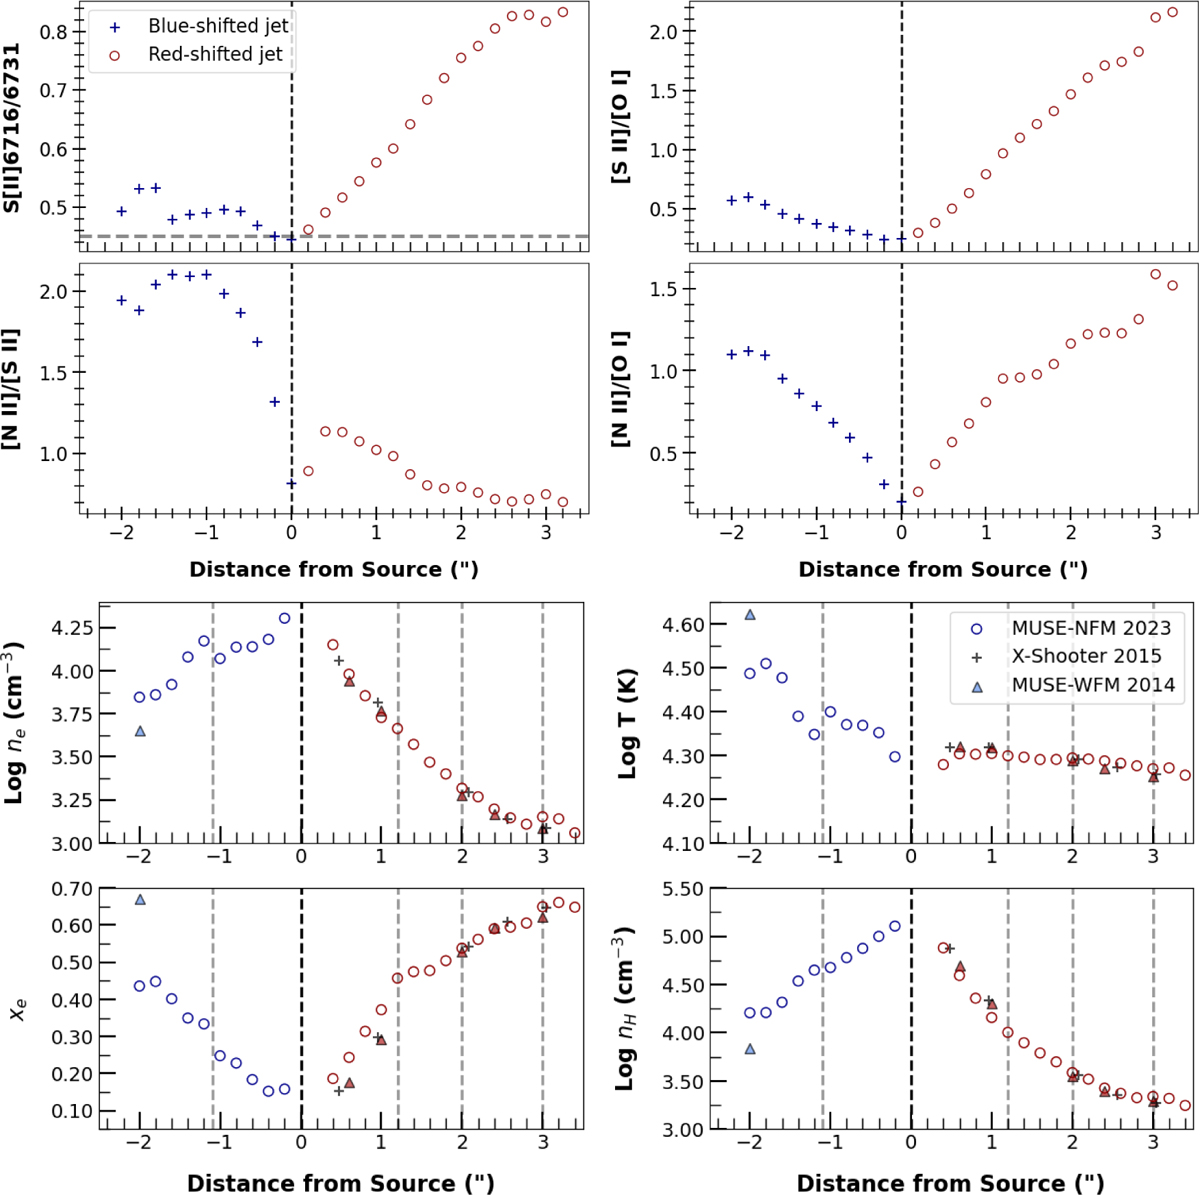
Results of the BE diagnostics along the jet axis. Top: flux ratios of FELs used for this analysis. The upper-left panel shows [S II]λλ6716/6731; the upper right-panel shows [S II]λλ(6716+6731)/[O I]λλ(6300+6363); the lower-left panel shows [N II]λλ(6548+6583)/[S II]λλ(6716+6731); and the lower-right panel shows [N II]λλ(6548+6583)/[O I]λλ(6300+6363). Fluxes are sampled from the inner ±0″.2 around the axis centre to highlight the properties of the central flow. The blueshifted and redshifted outflow directions are left and right of the source position (dashed black line) respectively. Bottom: derived gas properties obtained using the BE method to combine these lines. Here, the line fluxes are sampled across the full jet width (before deconvolution). Overplotted are the corresponding measurements from the previous MUSE-WFM and X-Shooter observations (Murphy et al. 2024). Dashed grey lines mark the knot positions.
Current usage metrics show cumulative count of Article Views (full-text article views including HTML views, PDF and ePub downloads, according to the available data) and Abstracts Views on Vision4Press platform.
Data correspond to usage on the plateform after 2015. The current usage metrics is available 48-96 hours after online publication and is updated daily on week days.
Initial download of the metrics may take a while.