Fig. 9
Download original image
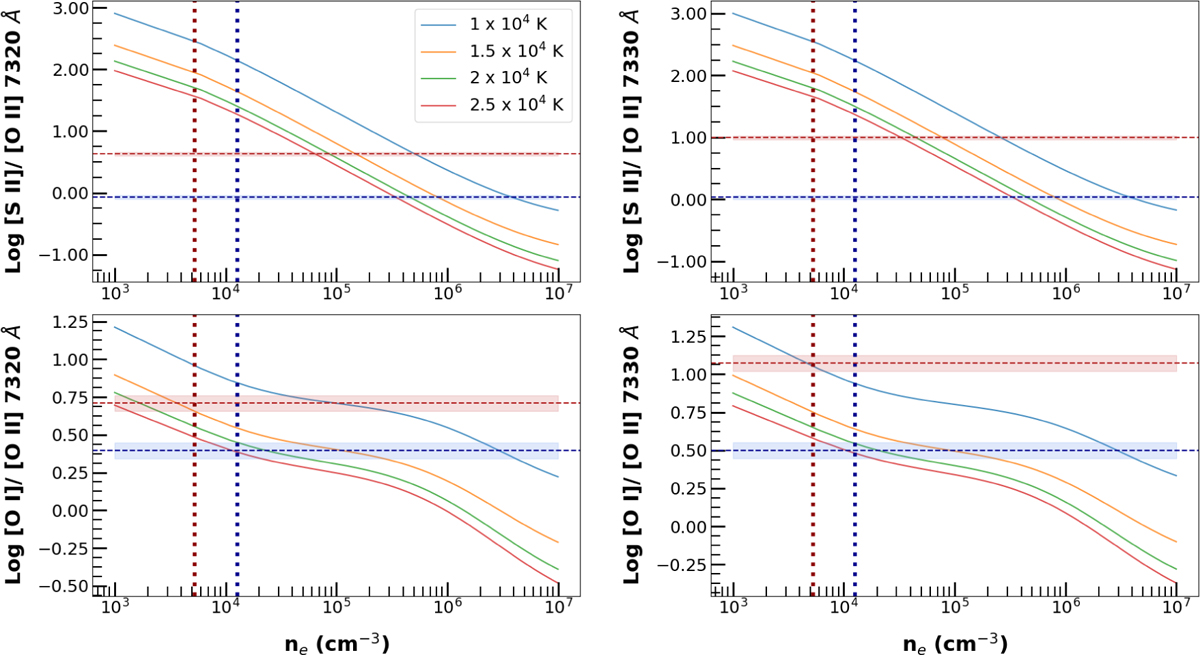
Theoretical curves for ratios of [S II], [O I], and [O II]. Horizontal dashed lines show the average ratio values in the redshifted and blueshifted jet lobes (red and blue lines), corrected for AV = 1 mag. The shaded regions show the minimum and maximum ratio values taking into account the uncertainty in flux calibration and allowing for a range of AV from 0 to 2 mag. Vertical dotted lines show the estimated ne in the redshifted and blueshifted lobes based on the BE method in Sect. 4.3.
Current usage metrics show cumulative count of Article Views (full-text article views including HTML views, PDF and ePub downloads, according to the available data) and Abstracts Views on Vision4Press platform.
Data correspond to usage on the plateform after 2015. The current usage metrics is available 48-96 hours after online publication and is updated daily on week days.
Initial download of the metrics may take a while.