Open Access
Fig. 1.
Download original image
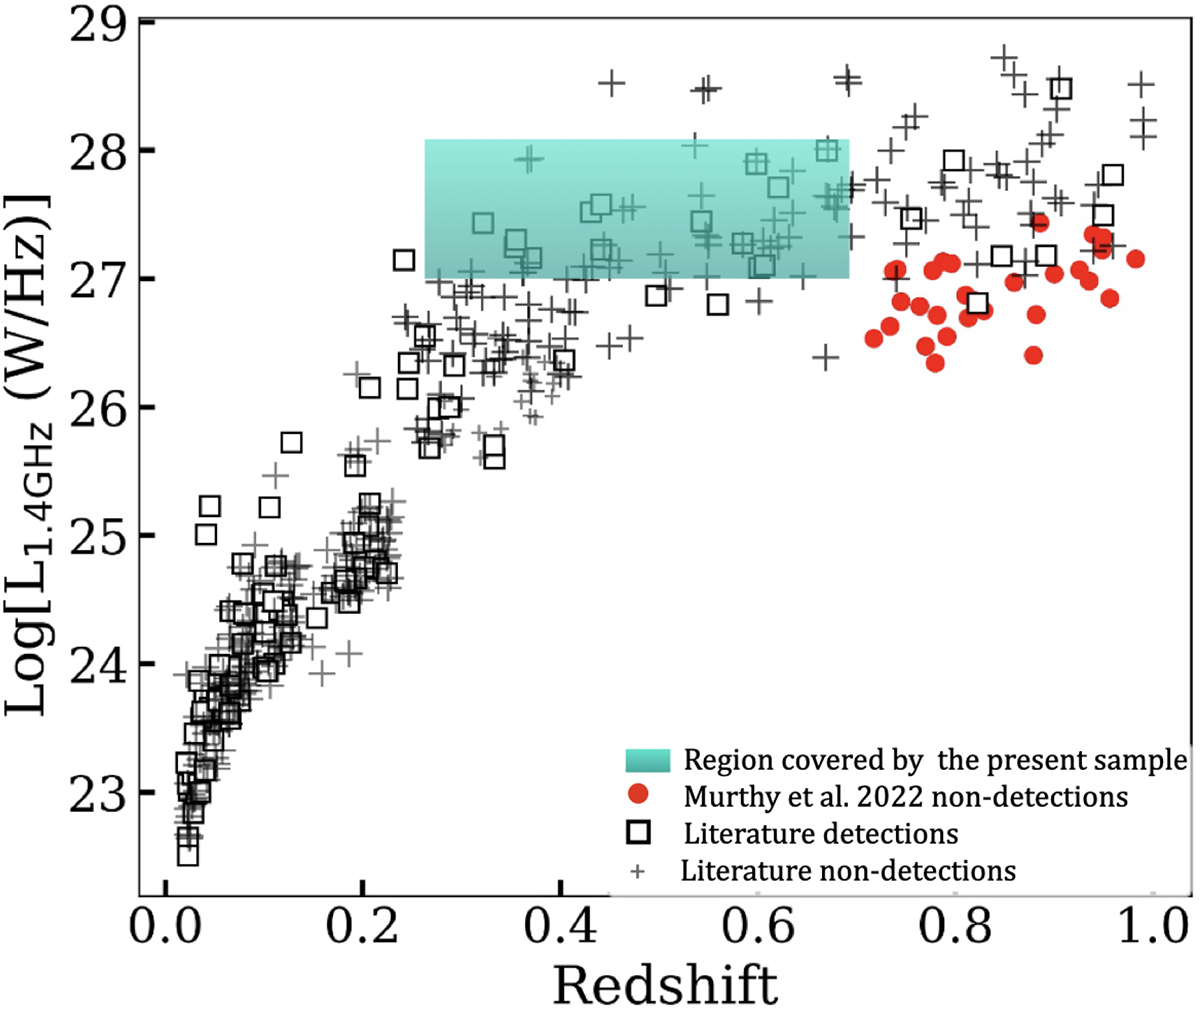
Distribution of the radio luminosities for sources in various samples available in literature, adapted from Murthy et al. (2022). Location of the present sample is indicated as the green area.
Current usage metrics show cumulative count of Article Views (full-text article views including HTML views, PDF and ePub downloads, according to the available data) and Abstracts Views on Vision4Press platform.
Data correspond to usage on the plateform after 2015. The current usage metrics is available 48-96 hours after online publication and is updated daily on week days.
Initial download of the metrics may take a while.