Open Access
Fig. 3.
Download original image
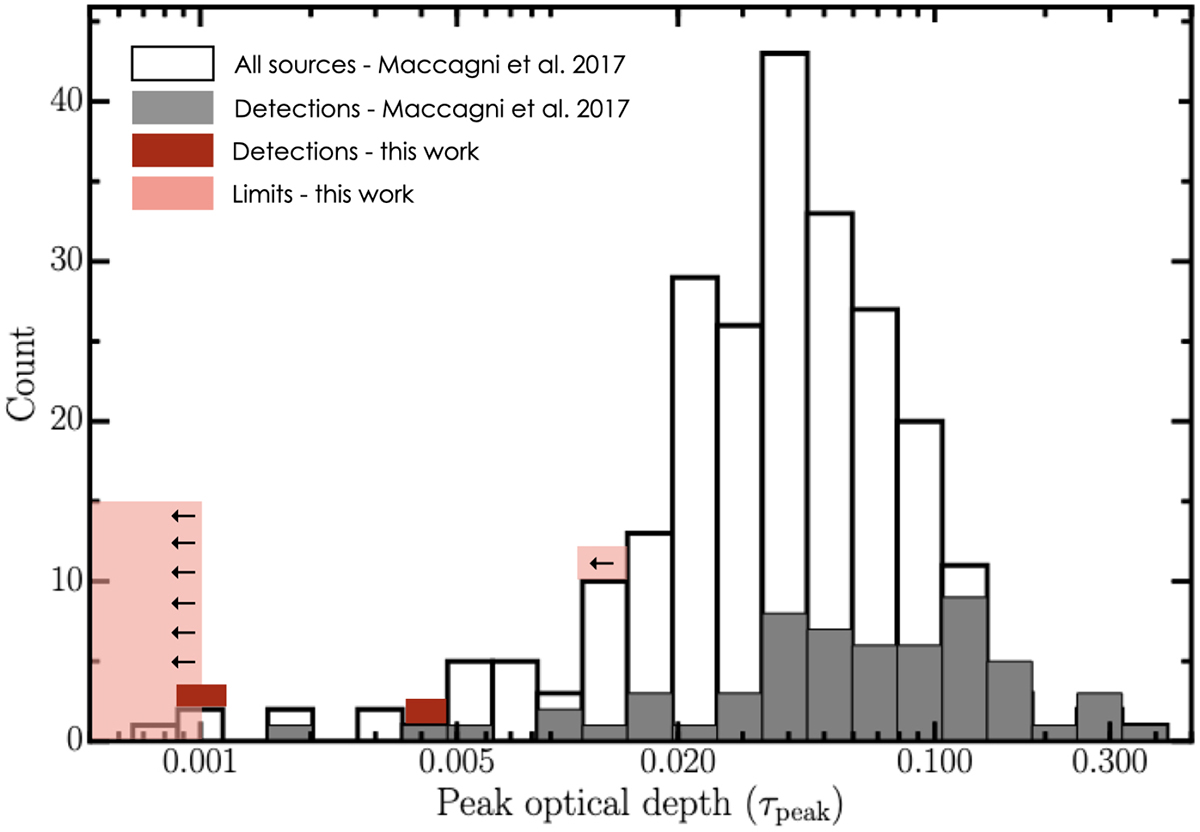
Distribution of the peak optical depth taken from Maccagni et al. (2017, grey and empty bars) with overlaid the peak optical depth for the detected (dark red boxes) and limits thereof (light red) for the sources of the present sample. The distribution shows how the present observations reach very low optical depths.
Current usage metrics show cumulative count of Article Views (full-text article views including HTML views, PDF and ePub downloads, according to the available data) and Abstracts Views on Vision4Press platform.
Data correspond to usage on the plateform after 2015. The current usage metrics is available 48-96 hours after online publication and is updated daily on week days.
Initial download of the metrics may take a while.