Open Access
Fig. 4.
Download original image
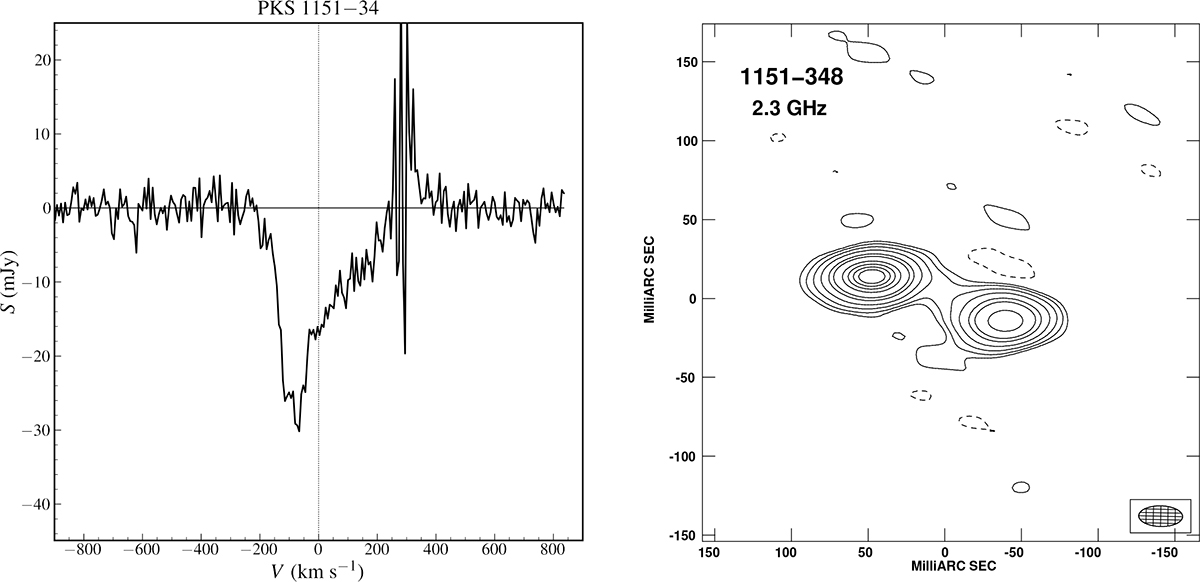
Left panel: H I absorption profile in PKS 1151–34. Note: the RFI affecting part of the band. The error in the zero-point of the velocity scale is 30 km s−1 (see Table 1). Right panel: VLBI image of PKS 1151–34 from Tzioumis et al. (2002). The continuum emission spans ∼700 pc.
Current usage metrics show cumulative count of Article Views (full-text article views including HTML views, PDF and ePub downloads, according to the available data) and Abstracts Views on Vision4Press platform.
Data correspond to usage on the plateform after 2015. The current usage metrics is available 48-96 hours after online publication and is updated daily on week days.
Initial download of the metrics may take a while.