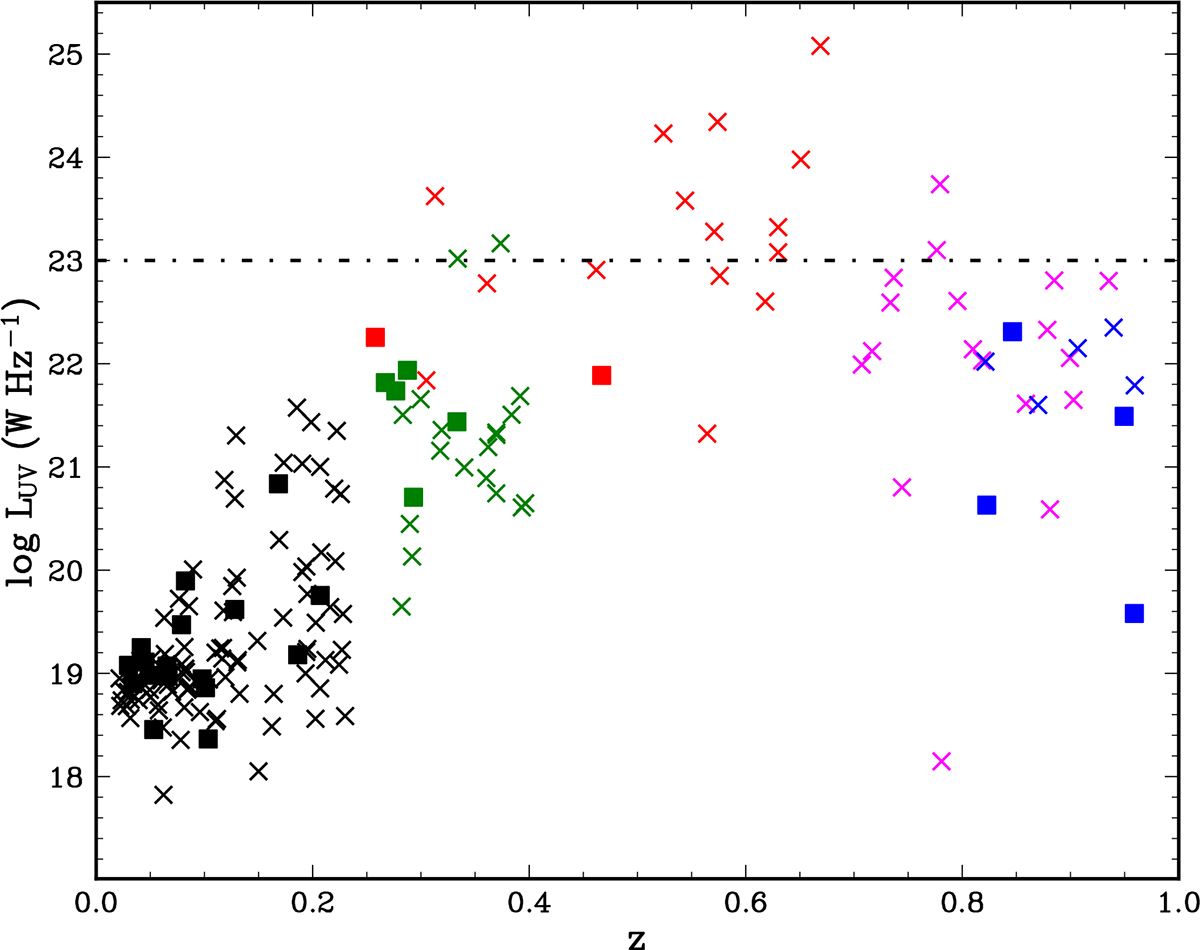
Fig. 9.
Download original image
UV luminosities for our sample (red points) together with some available in literature (black = Maccagni et al. (2017), green = Murthy et al. (2021), magenta = Murthy et al. (2022), and blue = Aditya (2019), adapted from Murthy et al. (2022). Square points are detections, crosses represent the limits. The dashed line represents the LUV = 1023 W Hz−1 threshold proposed by Curran et al. (2008, see text for details).
Current usage metrics show cumulative count of Article Views (full-text article views including HTML views, PDF and ePub downloads, according to the available data) and Abstracts Views on Vision4Press platform.
Data correspond to usage on the plateform after 2015. The current usage metrics is available 48-96 hours after online publication and is updated daily on week days.
Initial download of the metrics may take a while.