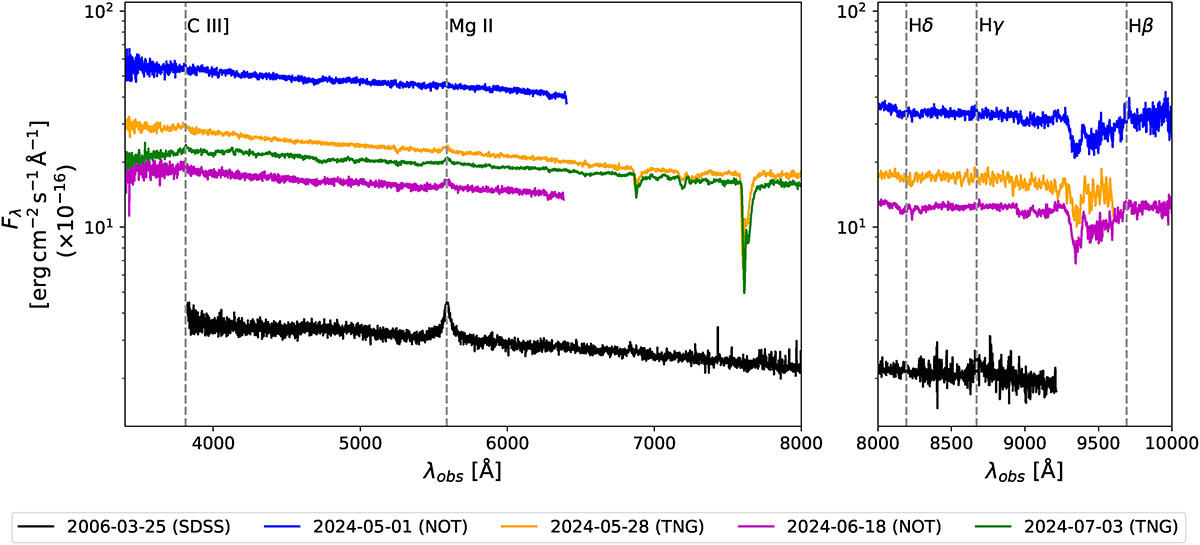
Fig. 1.
Download original image
Optical spectra of OP 313 observed with NOT and TNG telescopes. Left: Blue spectra. Right: Red spectra. The NOT spectrum from May 1 and June 18 are represented in blue and magenta, respectively. The TNG spectra from May 28 and July 3 are represented in orange and green, respectively. The TNG spectra represented here correspond to the co-added spectra of both exposures of each night. The SDSS spectrum taken on March 25, 2006, is also shown in black. The positions of the brightest emission lines reported in Vanden Berk et al. (2001) with a relative flux to the Lyα line 100 × F/FLyα ≥ 1 and within the spectral range of the observations presented in this work are highlighted with vertical dashed grey lines and indicated in the figure.
Current usage metrics show cumulative count of Article Views (full-text article views including HTML views, PDF and ePub downloads, according to the available data) and Abstracts Views on Vision4Press platform.
Data correspond to usage on the plateform after 2015. The current usage metrics is available 48-96 hours after online publication and is updated daily on week days.
Initial download of the metrics may take a while.