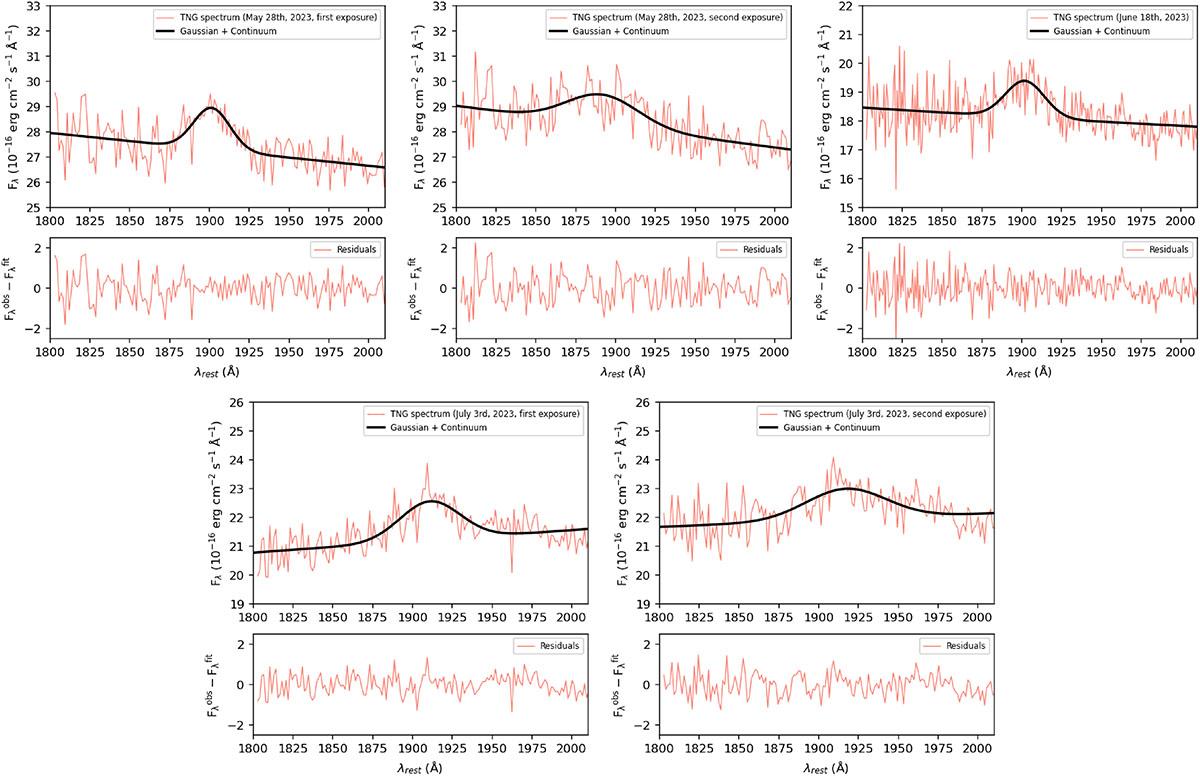
Fig. B.2.
Download original image
Modelling of the C III] line profile for the spectra taken by the NOT and TNG telescopes. Top left: TNG spectrum from May 28 (first exposure). Top middle: TNG spectrum from May 28 (second exposure). Top right: NOT spectrum from June 18. Bottom left: TNG spectrum from July 3 (first exposure). Bottom right: TNG spectrum from July 3 (second exposure). The spectra are fitted with one Gaussian component plus a linear function. The total fitted model is represented in black. The bottom panels show the residuals of the fits.
Current usage metrics show cumulative count of Article Views (full-text article views including HTML views, PDF and ePub downloads, according to the available data) and Abstracts Views on Vision4Press platform.
Data correspond to usage on the plateform after 2015. The current usage metrics is available 48-96 hours after online publication and is updated daily on week days.
Initial download of the metrics may take a while.