Open Access
Fig. 2.
Download original image
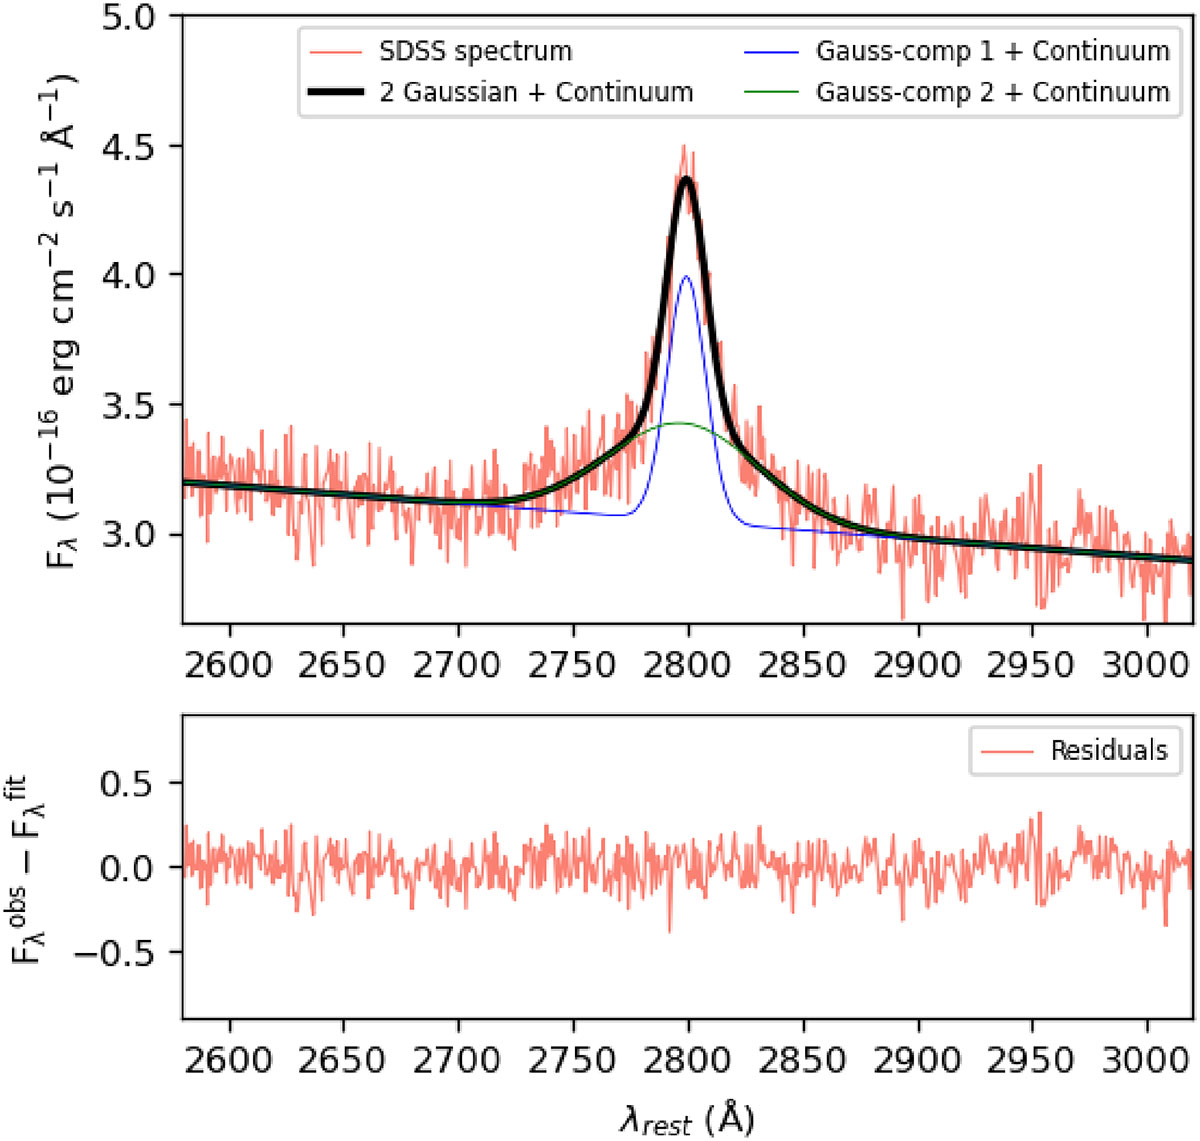
Modelling of the Mg II line profile for the spectrum taken by the SDSS with two Gaussian components plus a linear function to model the synchrotron continuum. The bottom panel shows the residuals of the fit.
Current usage metrics show cumulative count of Article Views (full-text article views including HTML views, PDF and ePub downloads, according to the available data) and Abstracts Views on Vision4Press platform.
Data correspond to usage on the plateform after 2015. The current usage metrics is available 48-96 hours after online publication and is updated daily on week days.
Initial download of the metrics may take a while.