Fig. 4.
Download original image
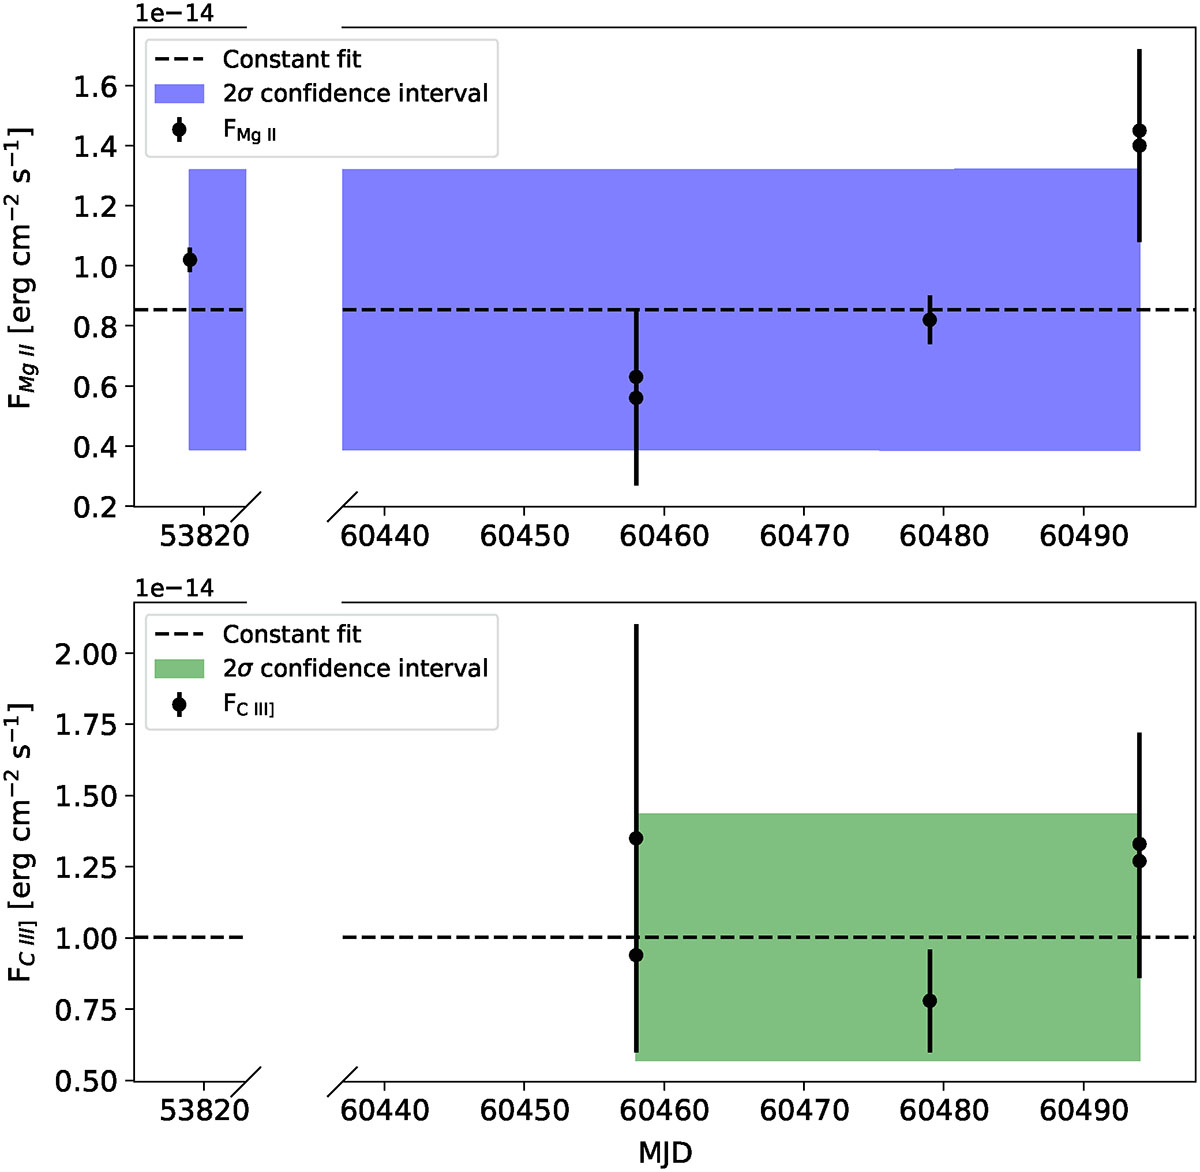
Constant fit to the measured flux of the Mg II and C III] emission lines over time for the different spectra analysed here. Top: Mg II line. Bottom: C III] line. The black points correspond to the observational measurements. The black dashed line is the best fit constant value obtained and the blue and green contours represents the 2σ confidence interval of the fit in each case.
Current usage metrics show cumulative count of Article Views (full-text article views including HTML views, PDF and ePub downloads, according to the available data) and Abstracts Views on Vision4Press platform.
Data correspond to usage on the plateform after 2015. The current usage metrics is available 48-96 hours after online publication and is updated daily on week days.
Initial download of the metrics may take a while.