Fig. 5.
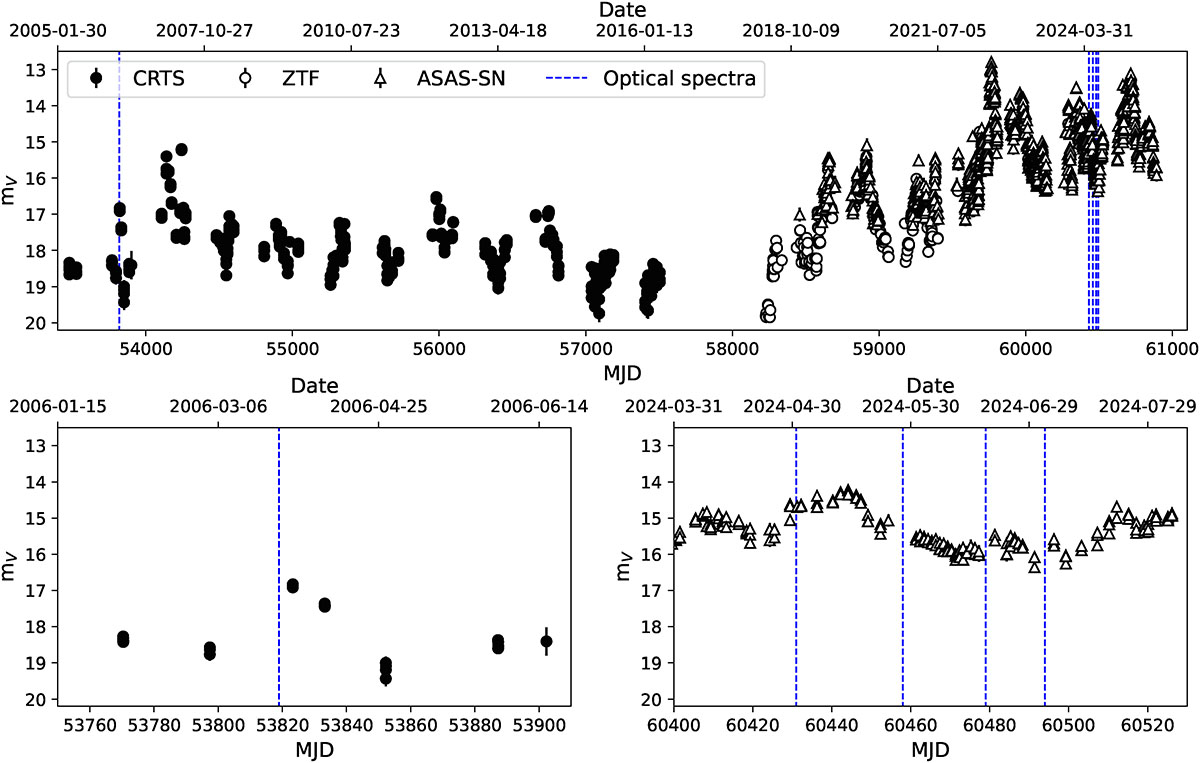
Download original image
Historical optical V-band light curve of OP 313. Different markers represent data from the different databases used, as shown in the legend. Blue vertical lines highlight the dates of the spectroscopic observations. The top panel shows the complete light curve while the bottom left and right panels show the zoomed-in light curves around the dates of the SDSS and NOT/TNG spectra, respectively.
Current usage metrics show cumulative count of Article Views (full-text article views including HTML views, PDF and ePub downloads, according to the available data) and Abstracts Views on Vision4Press platform.
Data correspond to usage on the plateform after 2015. The current usage metrics is available 48-96 hours after online publication and is updated daily on week days.
Initial download of the metrics may take a while.