Fig. A.2.
Download original image
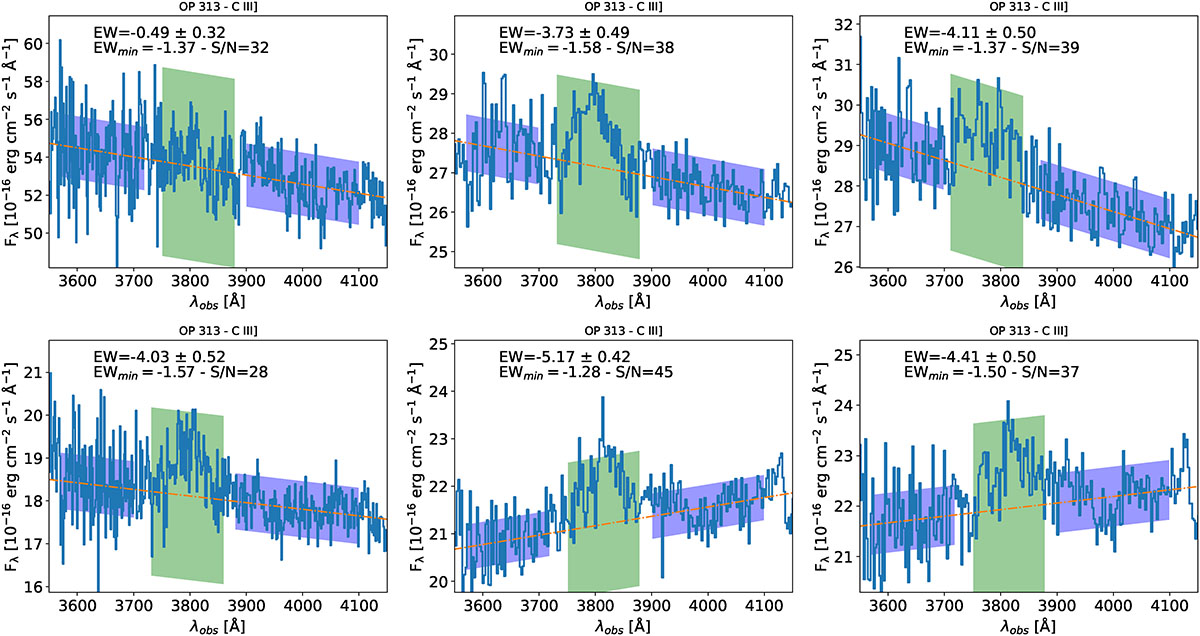
Measurement of the EWmin for the C III] emission line of the OP 313 spectra analysed in this work. Top left: NOT spectrum from May 1. Top middle: TNG spectrum from May 28 (first exposure). Top right: TNG spectrum from May 28 (second exposure). Bottom left: NOT spectrum from June 18. Bottom middle: TNG spectrum from July 3 (first exposure). Bottom right: TNG spectrum from July 3 (second exposure). Continuum regions are represented in blue and their vertical size corresponds to the 1σ noise value. The window of the emission line is highlighted in green and its size represents a 3σ noise value. The continuum interpolation is represented by the dotted-dashed line.
Current usage metrics show cumulative count of Article Views (full-text article views including HTML views, PDF and ePub downloads, according to the available data) and Abstracts Views on Vision4Press platform.
Data correspond to usage on the plateform after 2015. The current usage metrics is available 48-96 hours after online publication and is updated daily on week days.
Initial download of the metrics may take a while.