Fig. 2.
Download original image
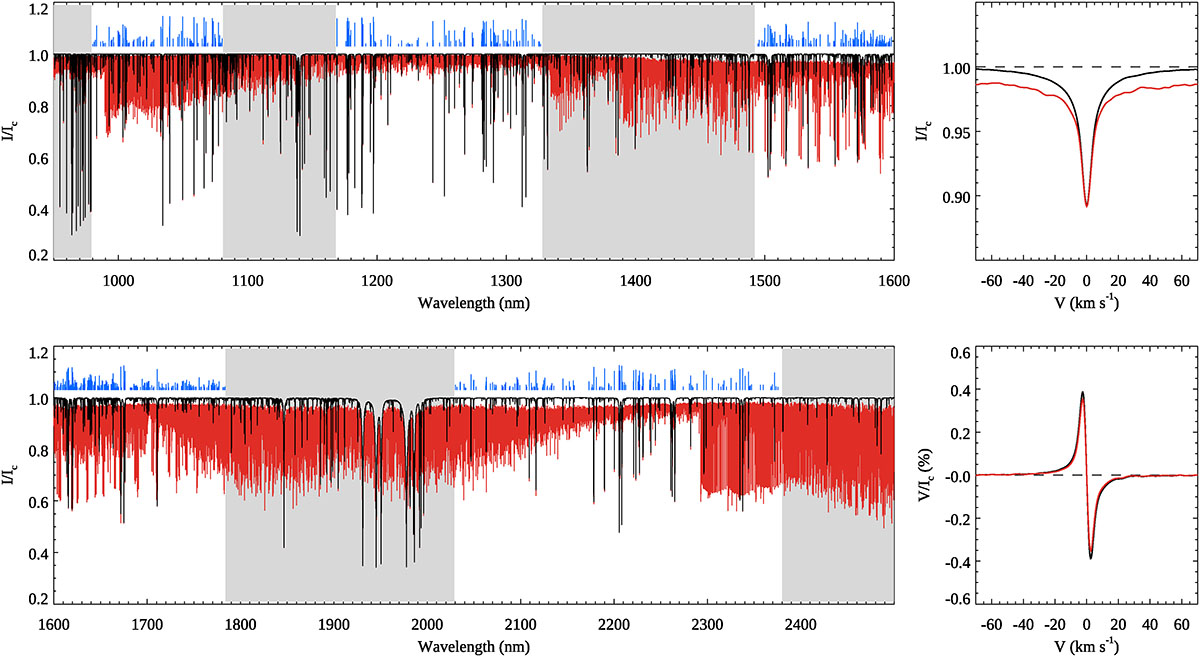
Theoretical near-infrared M-dwarf synthetic spectra and corresponding LSD profiles. Left panels: disk-centre Stokes I spectra computed for a model atmosphere with Teff = 3500 K and log g = 5.0, both with (red) and without (black) molecular line opacity. A 100 G line-of-sight magnetic field was adopted for these calculations. Blue bars above the spectra mark the positions of atomic lines included in the LSD mask, with bar lengths proportional to their central depths. Grey rectangles highlight wavelength regions excluded from the analysis because they are heavily contaminated by telluric absorption in typical ground-based observations. Right panels: Corresponding LSD profiles: Stokes I (upper) and Stokes V (lower).
Current usage metrics show cumulative count of Article Views (full-text article views including HTML views, PDF and ePub downloads, according to the available data) and Abstracts Views on Vision4Press platform.
Data correspond to usage on the plateform after 2015. The current usage metrics is available 48-96 hours after online publication and is updated daily on week days.
Initial download of the metrics may take a while.