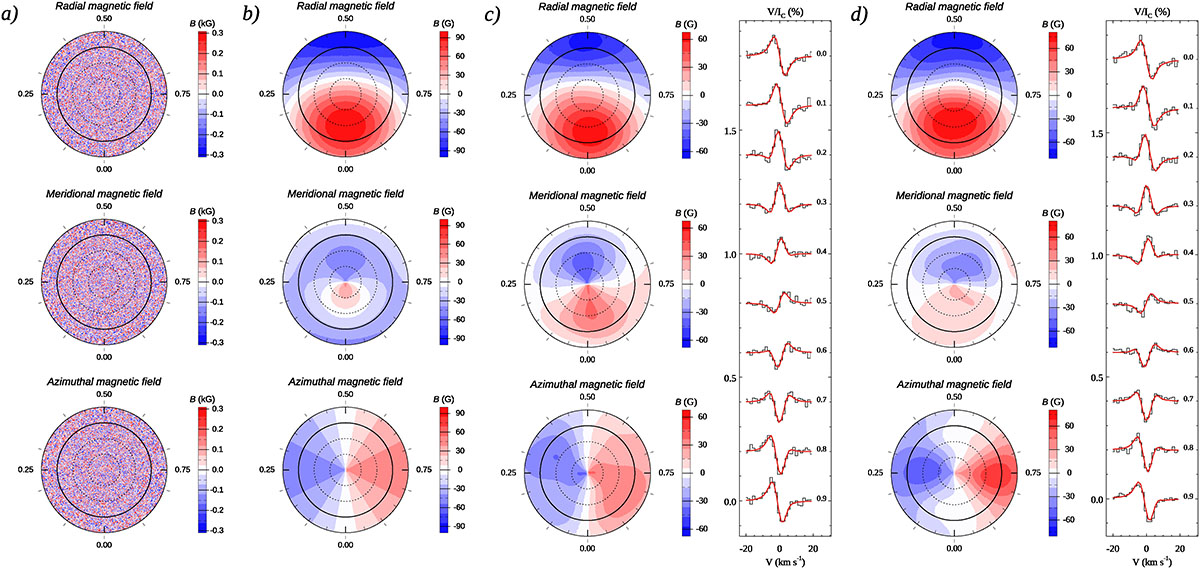
Fig. 6.
Download original image
Comparison between the input small-scale (a) and global (b) magnetic field geometry and ZDI reconstructions using two approaches: the single-line LSD-UR profile approximation (c) and a multi-line numerical model incorporating a small-scale field (d; LSD-PRT). Each panel presents flattened polar projections of the radial, meridional, and azimuthal components of the small-scale (a) or global (b–d) magnetic field. The thick circle marks the stellar equator, with dotted lines drawn every 30° in latitude. The right columns of panels (c) and (d) show the simulated observed Stokes V spectra (black histograms) alongside the corresponding ZDI fits (solid red lines). Profiles are vertically offset according to rotational phase, with the corresponding phases listed to the right of the profiles. For this test, the star was modelled with a global dipolar field of strength Bd = 100 G and obliquity β = 60°, along with an isotropic small-scale magnetic component of Bs = 300 G.
Current usage metrics show cumulative count of Article Views (full-text article views including HTML views, PDF and ePub downloads, according to the available data) and Abstracts Views on Vision4Press platform.
Data correspond to usage on the plateform after 2015. The current usage metrics is available 48-96 hours after online publication and is updated daily on week days.
Initial download of the metrics may take a while.