Fig. 2.
Download original image
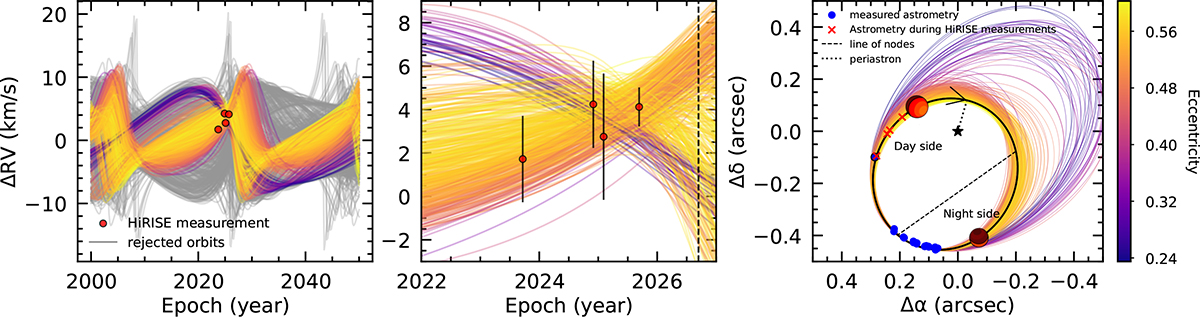
Orbit of 51 Eri b. The left panel shows the predicted RV of the planet as a function of time. The HiRISE RV measurements are overplotted as red dots, along with the rejected orbits in grey from the addition of the RV measurements. The middle panel is a zoomed-in version of the left panel around our RV measurements. In particular, we see that a future RV measurement at the end of 2026 should enable us to reject the last low-eccentric orbital populations. This is illustrated by the dashed vertical line overplotted at the end of 2026. The right panel displays the astrometric orbit of the planet inferred, including the line of nodes and the phase of the planet. The red crosses represent the estimate of the position of the planet during the HiRISE observations.
Current usage metrics show cumulative count of Article Views (full-text article views including HTML views, PDF and ePub downloads, according to the available data) and Abstracts Views on Vision4Press platform.
Data correspond to usage on the plateform after 2015. The current usage metrics is available 48-96 hours after online publication and is updated daily on week days.
Initial download of the metrics may take a while.