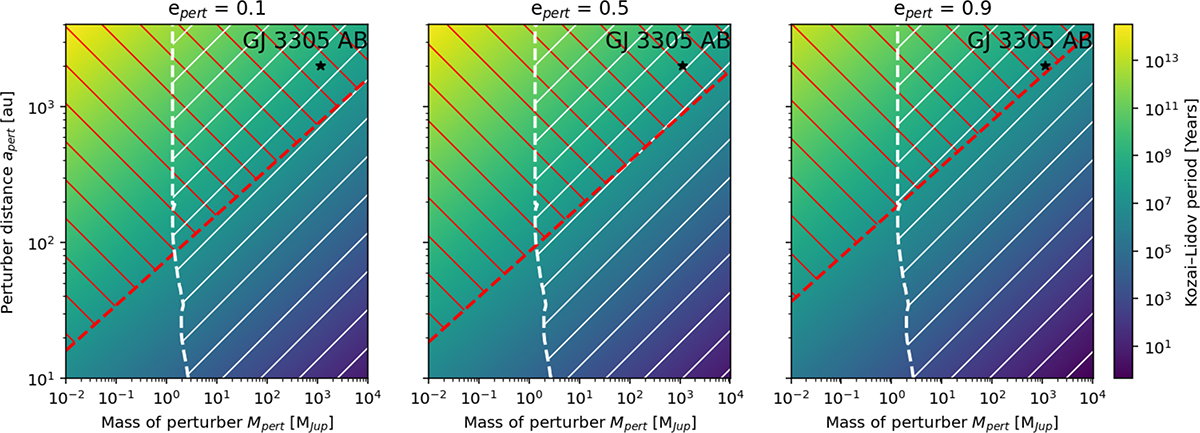
Fig. E.2.
Download original image
Kozai–Lidov oscillation timescale as a function of the perturber mass and semi-major axis for different eccentricities. The SPHERE/IRDIS detection limits are shown in white; perturbers located to the right of this curve (white hatched region) would be detectable by SPHERE. The red curve indicates the age of the system, with the red hatched region corresponding to Kozai–Lidov timescales longer than the system age. The position of the stellar binary companion GJ 3305 AB is also indicated.
Current usage metrics show cumulative count of Article Views (full-text article views including HTML views, PDF and ePub downloads, according to the available data) and Abstracts Views on Vision4Press platform.
Data correspond to usage on the plateform after 2015. The current usage metrics is available 48-96 hours after online publication and is updated daily on week days.
Initial download of the metrics may take a while.