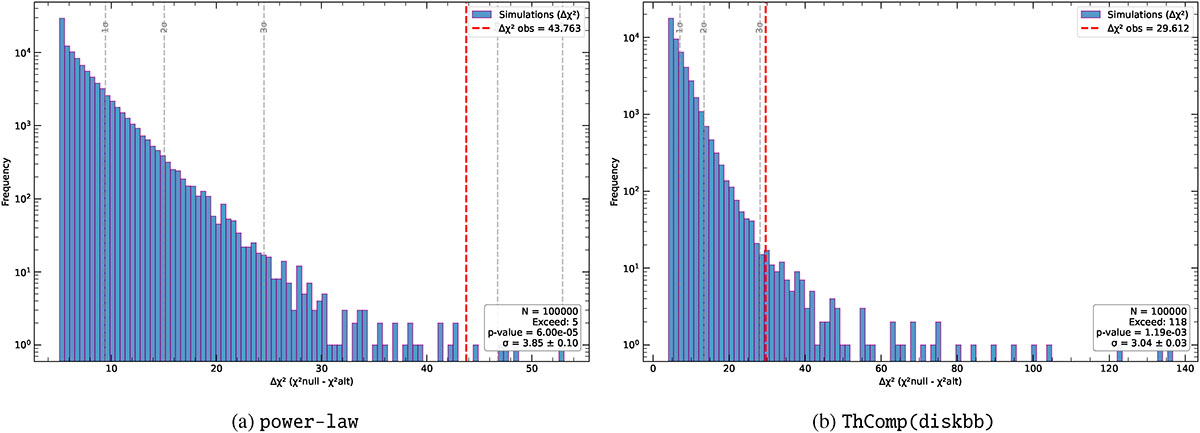
Fig. B.1.
Download original image
Distribution of the simulated Δχ2 values for the EPIC-pn spectra, obtained from 105 Likelihood Ratio Test (LRT) simulations in XSPEC. Left panel: simulations performed under the null model (powerlaw), comparing powerlaw versus gabs*powerlaw. Right panel: simulations performed under the null model (ThComp(diskbb)), comparing ThComp(diskbb) versus gabs*ThComp(diskbb). In both panels, the red dashed lines mark the observed Δχ2 obtained from the real data when including the multiplicative Gaussian absorption component at ∼3.3 keV. The shaded histograms show the simulated Δχ2 distributions under the null hypothesis, while the vertical gray dashed lines indicate the nominal 1–3σ thresholds for reference.
Current usage metrics show cumulative count of Article Views (full-text article views including HTML views, PDF and ePub downloads, according to the available data) and Abstracts Views on Vision4Press platform.
Data correspond to usage on the plateform after 2015. The current usage metrics is available 48-96 hours after online publication and is updated daily on week days.
Initial download of the metrics may take a while.