Fig. B.3.
Download original image
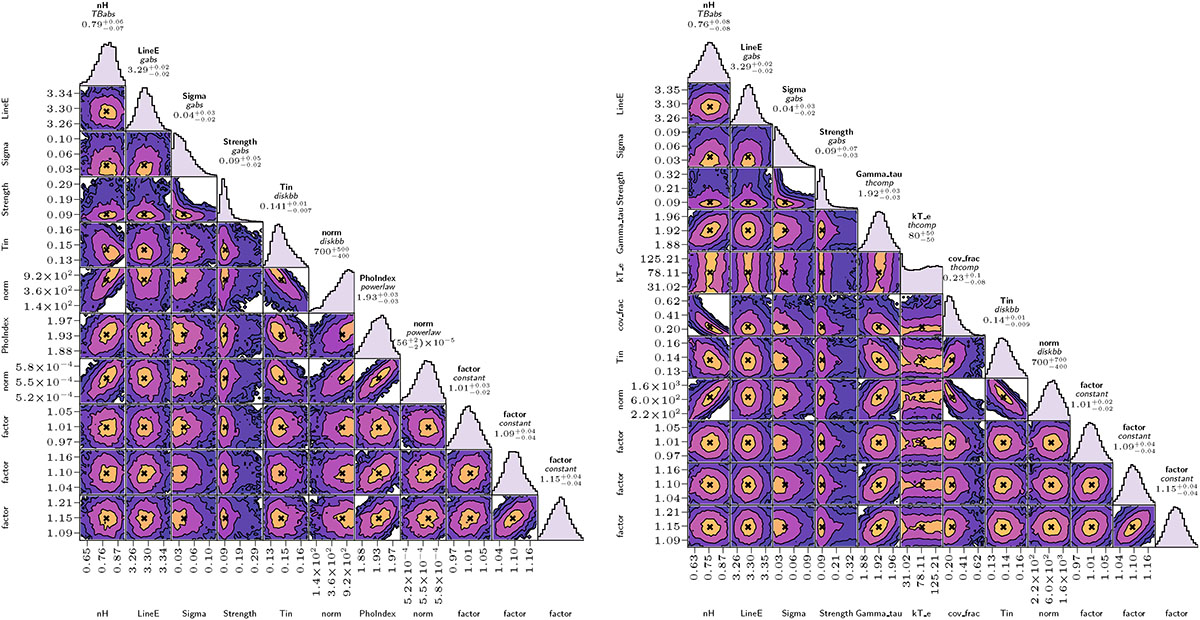
Corner plots showing the posterior probability distributions of the best-fit parameters for the pn+MOS2 detectors obtained from the MCMC analysis of the two tested models with gabs: Power-law + diskbb (left) and ThComp(diskbb) (right). NH and Tin are expressed in units of 1022 cm−2 and keV, respectively. Each distribution is based on 106 converged MCMC iterations.
Current usage metrics show cumulative count of Article Views (full-text article views including HTML views, PDF and ePub downloads, according to the available data) and Abstracts Views on Vision4Press platform.
Data correspond to usage on the plateform after 2015. The current usage metrics is available 48-96 hours after online publication and is updated daily on week days.
Initial download of the metrics may take a while.