Fig. 2.
Download original image
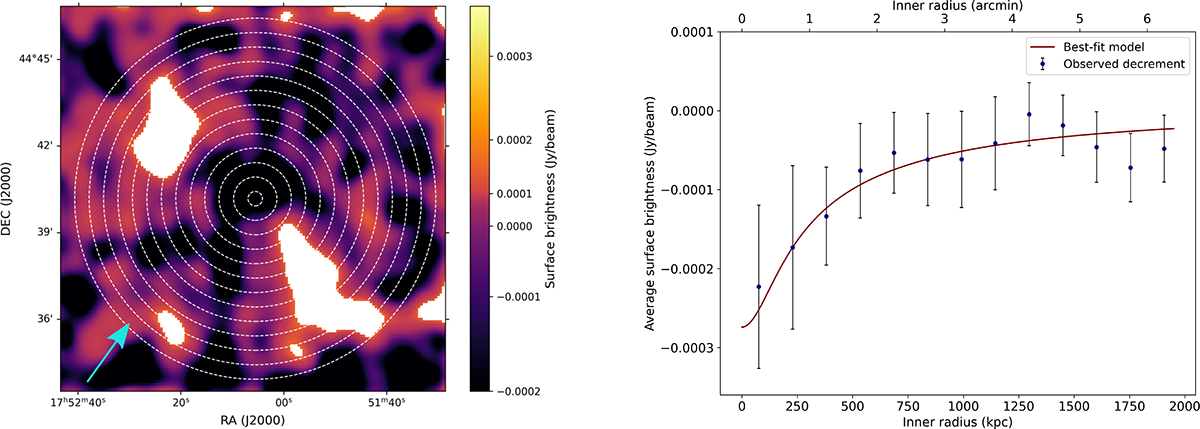
Left: Map of the observed surface brightness decrement in the cluster centre from SRT data at 18.6 GHz. The profile reported on the right was obtained by blanking the radio sources and tracing annuli around the centre of the cluster, at intervals of a half-beam radius from one another. The blue arrow marks a localised surface-brightness excess in the south-eastern region. Right: Observed average surface brightness on annuli around the centre of the cluster, in blue. The continuous line shows the fit of the SZ decrement referred to the models from Eqs. (2) and (4).
Current usage metrics show cumulative count of Article Views (full-text article views including HTML views, PDF and ePub downloads, according to the available data) and Abstracts Views on Vision4Press platform.
Data correspond to usage on the plateform after 2015. The current usage metrics is available 48-96 hours after online publication and is updated daily on week days.
Initial download of the metrics may take a while.