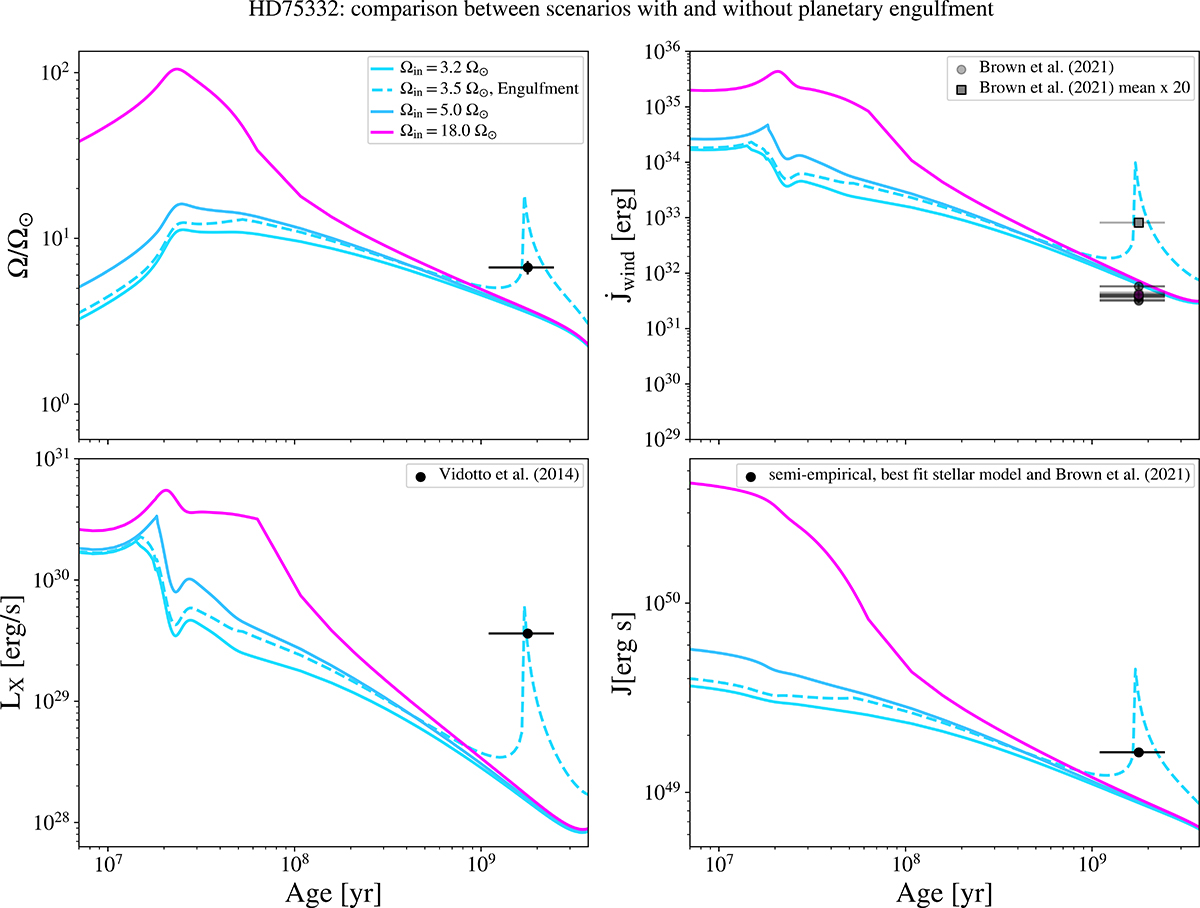
Fig. E.1.
Download original image
Evolutionary tracks computed for HD 75332. The scenarios without (solid lines) and with (dashed line) the engulfment of a 3 MJ planet at an initial orbital distance ain = 0.025 AU are included. For the stellar initial surface rotation rate, we considered values of Ωin(Ω⊙) = 3.2, 5.0, 18, as representative of the evolution as slow, moderate and fast rotator (Eggenberger et al. 2019). The spike featured by the dashed line indicates the effect the planetary engulfment has on the stellar property. In the top-left panel, the black dot shows the observed surface rotation rate as in Brown et al. (2021). In the top-right panel, the black dots shows the estimates of angular momentum loss derived by using the prescription in Finley & Matt (2018) and the values in Table 2 of Brown et al. (2021). The gray square shows the mean value of the angular momentum loss estimates multiplied by a factor 20. In the bottom-left panel, the back dot shows the observational value of the X-ray luminosity from Vidotto et al. (2014a). In the bottom-right panel, the black dot shows the semi-empirical angular momentum obtained by multiplying the best-fit stellar model momentum of inertia by the surface rotation rate in Brown et al. (2021).
Current usage metrics show cumulative count of Article Views (full-text article views including HTML views, PDF and ePub downloads, according to the available data) and Abstracts Views on Vision4Press platform.
Data correspond to usage on the plateform after 2015. The current usage metrics is available 48-96 hours after online publication and is updated daily on week days.
Initial download of the metrics may take a while.