Open Access
Fig. 1.
Download original image
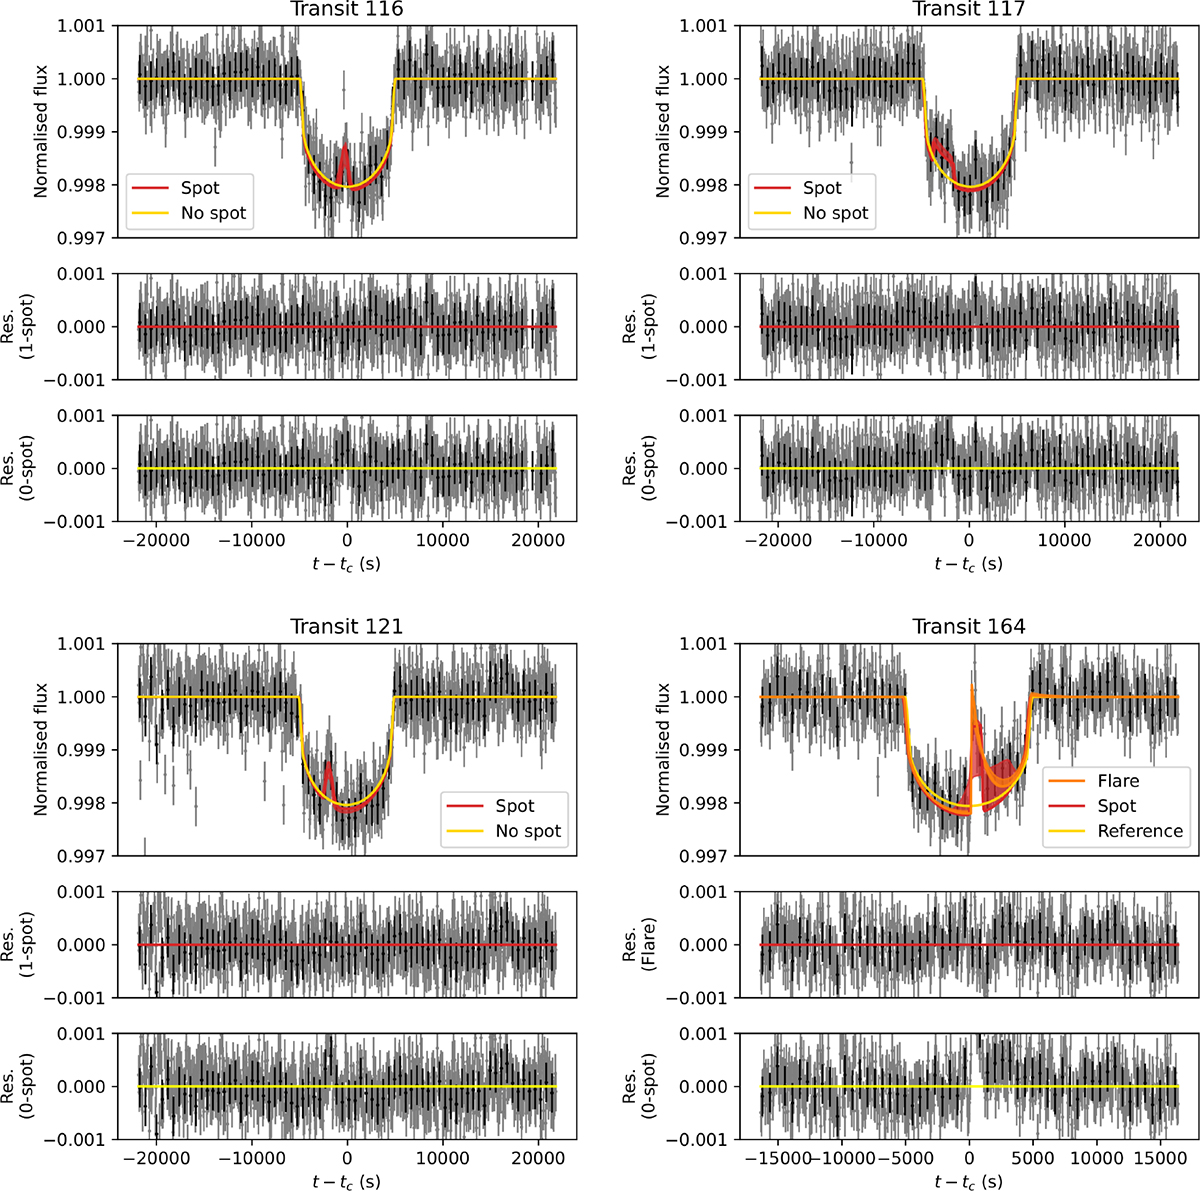
Identified occultations of spots by Kepler-411 c during transit events 116, 117, and 121 and a flare event occurring during transit 164. The yellow, red and orange curves denote the reference model, a model with a spot occultation, and a model with a flare event, respectively.
Current usage metrics show cumulative count of Article Views (full-text article views including HTML views, PDF and ePub downloads, according to the available data) and Abstracts Views on Vision4Press platform.
Data correspond to usage on the plateform after 2015. The current usage metrics is available 48-96 hours after online publication and is updated daily on week days.
Initial download of the metrics may take a while.