Fig. 3.
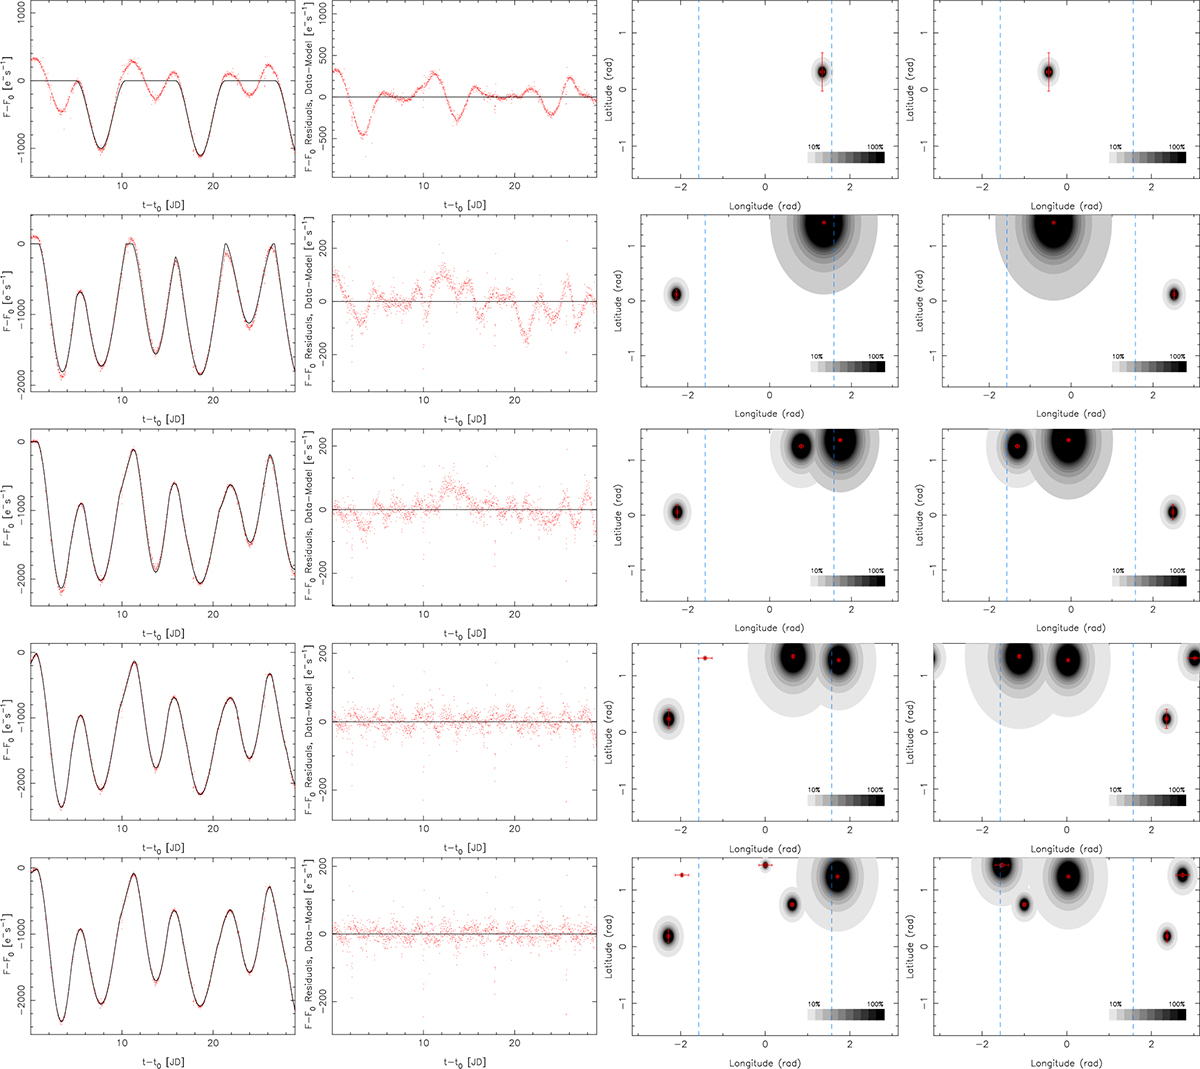
Download original image
Each row of panels contains Kepler-411 data (red dots) and MAP solutions (black curves), model residuals, and estimated spot maps for epochs 1044.016 and 1051.851 corresponding to the mean times of transits 116 and 117. The rows from top to bottom are for models with k = 1, …, 5. The blue vertical dashed lines denote the surface visible at those epochs. The greyscale denotes a range of spot sizes and contrasts as estimated based on the effect of the corresponding spot on the flux. The red circles and the corresponding uncertainty intervals denote MAP spot positions and standard errors. The reference time is t0 = 1034.0 days. Only absolute values of latitude are known and all spots are placed on the same hemisphere.
Current usage metrics show cumulative count of Article Views (full-text article views including HTML views, PDF and ePub downloads, according to the available data) and Abstracts Views on Vision4Press platform.
Data correspond to usage on the plateform after 2015. The current usage metrics is available 48-96 hours after online publication and is updated daily on week days.
Initial download of the metrics may take a while.