Open Access
Fig. 5.
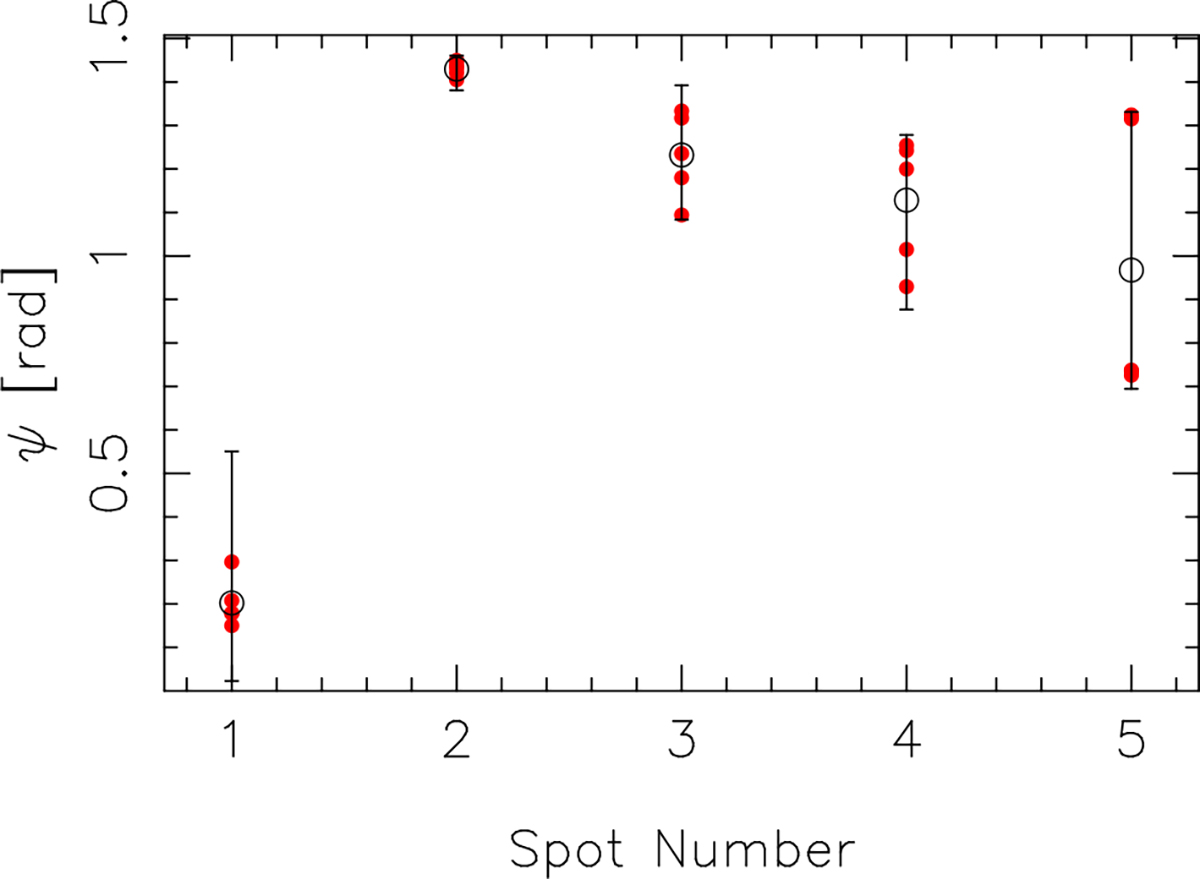
Download original image
Estimated latitudes (black circles) of the five spots identified in the data subset S1034. The red dots show where high posterior probabilities (above 1% of the global maximum) were first identified by five samplings for which spots were randomly truncated to positions near the equator or the pole.
Current usage metrics show cumulative count of Article Views (full-text article views including HTML views, PDF and ePub downloads, according to the available data) and Abstracts Views on Vision4Press platform.
Data correspond to usage on the plateform after 2015. The current usage metrics is available 48-96 hours after online publication and is updated daily on week days.
Initial download of the metrics may take a while.