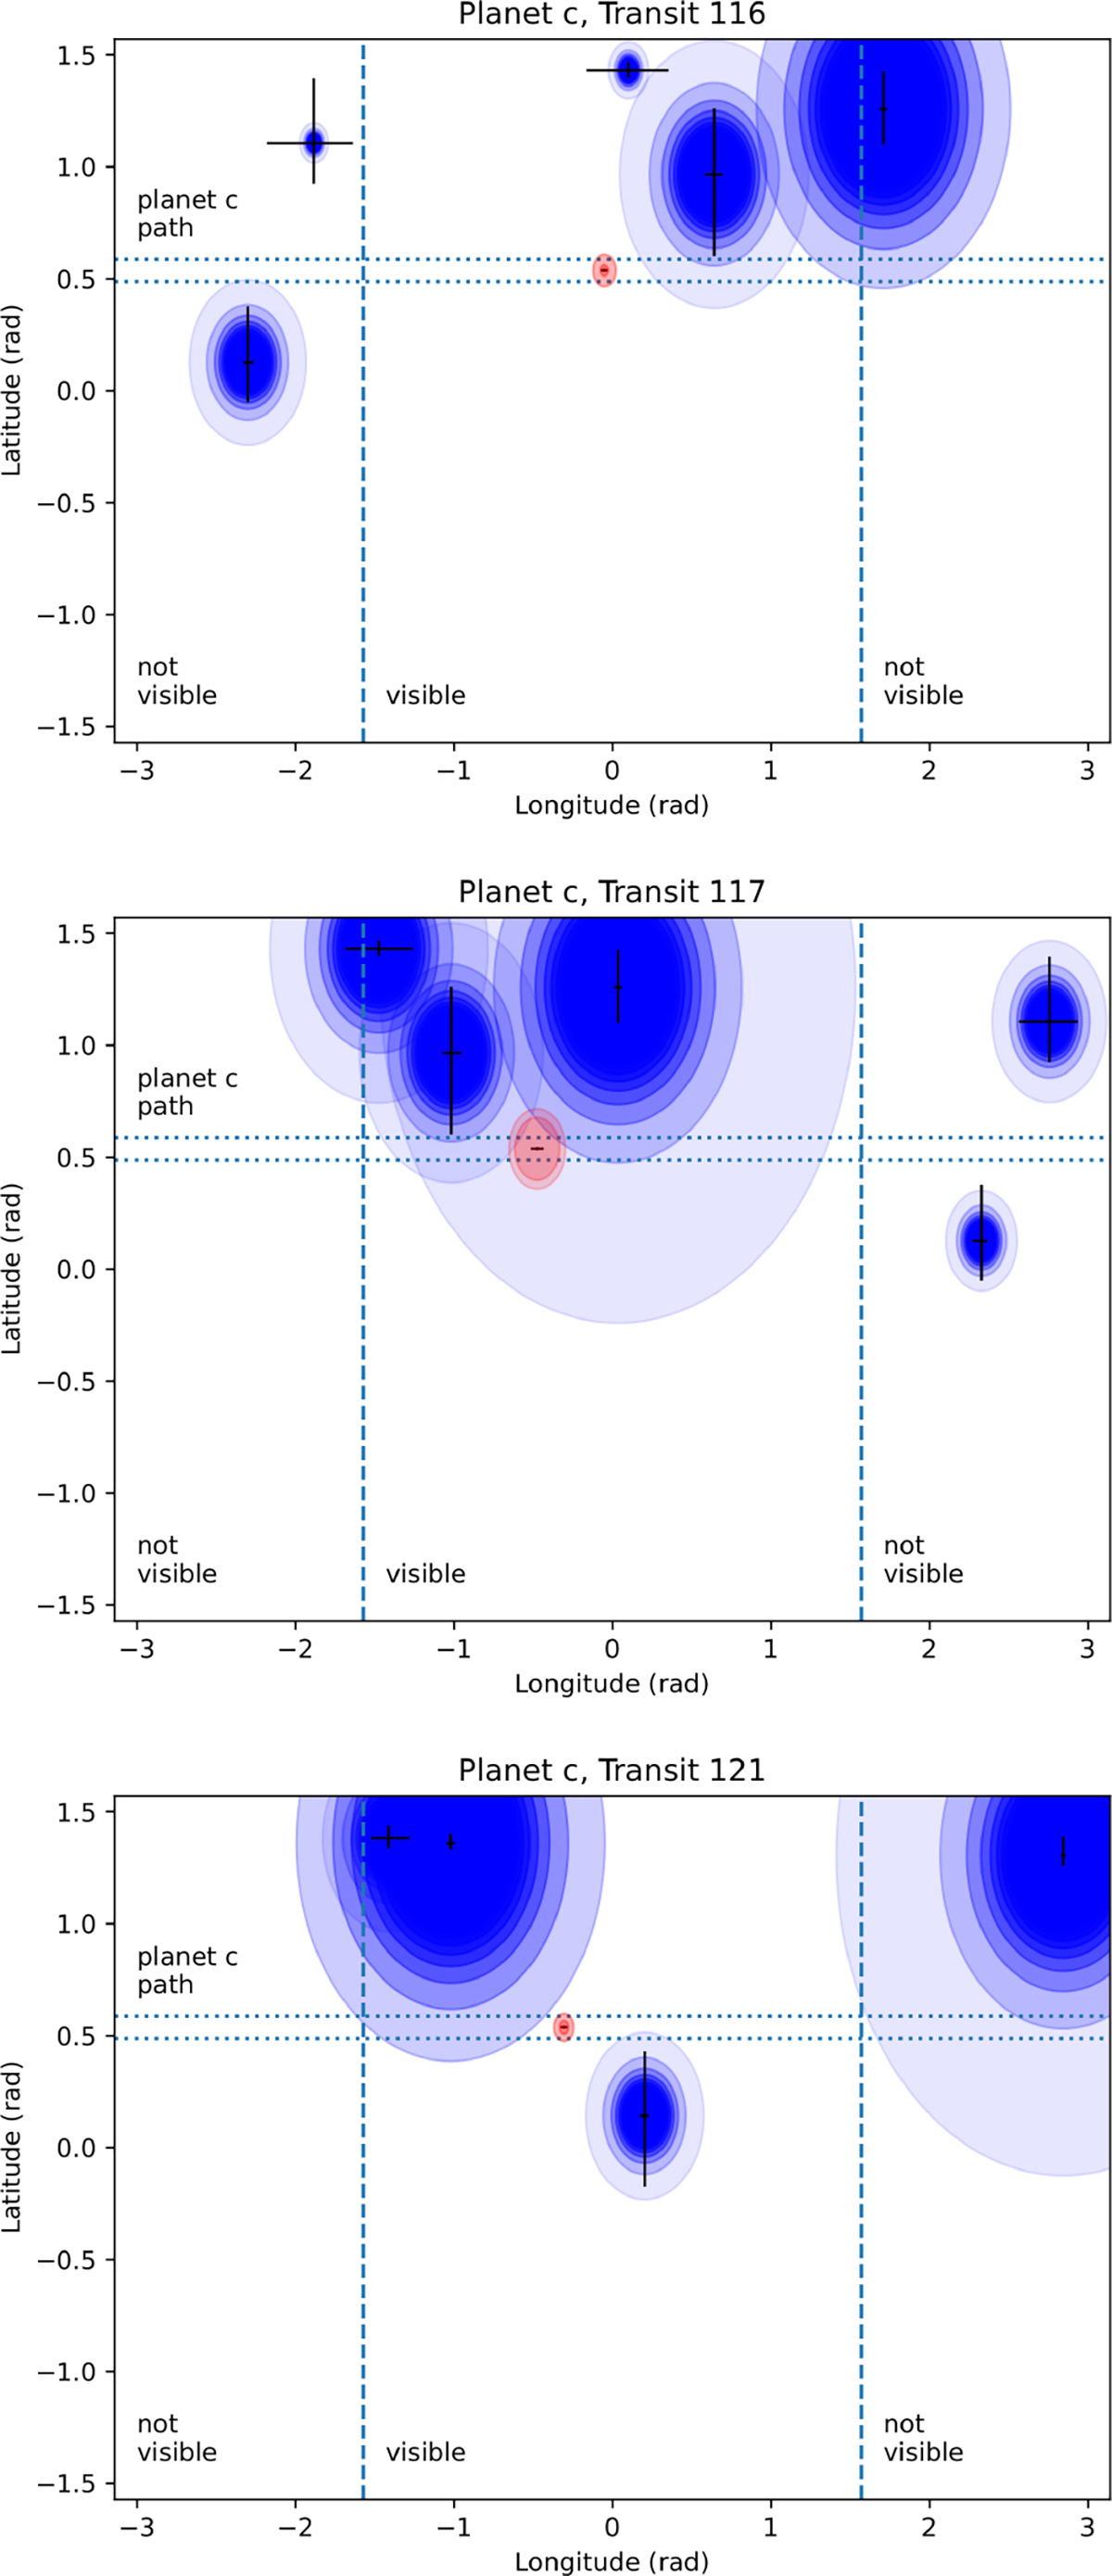
Fig. 6.
Download original image
Comparison of estimated spot patterns on the surface of Kepler-411 based on spot occultation results (red) and rotational modulation results (blue) for transit events 116, 117, and 121 (top to bottom). The different shades of blue (from dark to light) denote a range of spot sizes and their contrasts from 1.0 to 0.1 with intervals of 0.1.
Current usage metrics show cumulative count of Article Views (full-text article views including HTML views, PDF and ePub downloads, according to the available data) and Abstracts Views on Vision4Press platform.
Data correspond to usage on the plateform after 2015. The current usage metrics is available 48-96 hours after online publication and is updated daily on week days.
Initial download of the metrics may take a while.