Fig. 5
Download original image
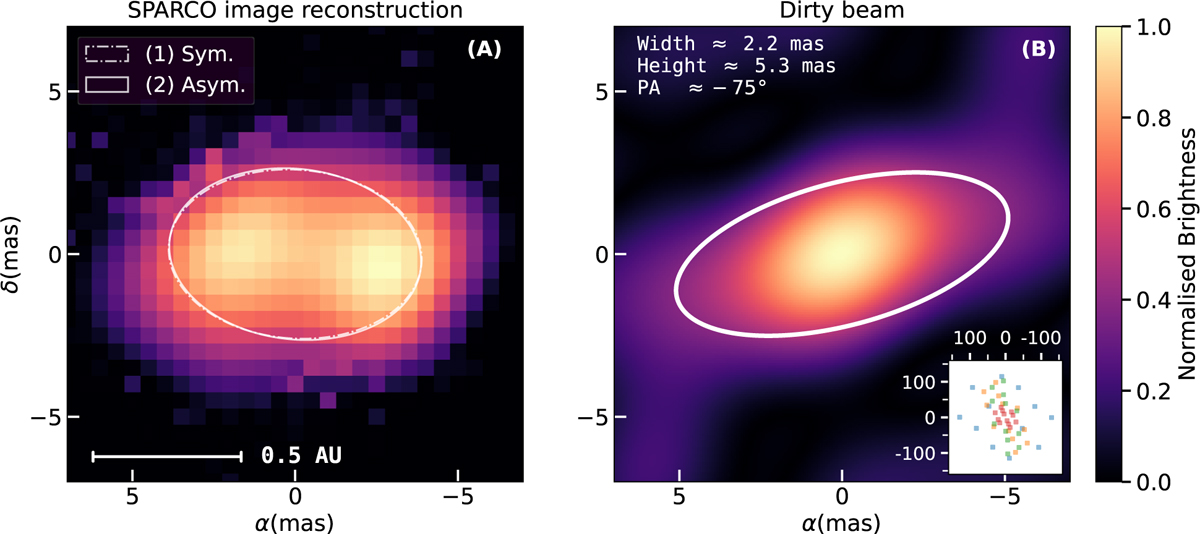
Panel A: L band image reconstruction for the 2021 MATISSE AT observations, which contain the large-medium-small arrays observed within 11 days, at λ = 3.6 ± 0.2 μm using the SPARCO/MIRA software. The central star with T = 7250 K, modelled as a point source centred on (0,0), is not shown. We over-plot ellipses with semi-major axes of the half-light radius la, taken from the best parametric fits of Table 3. Panel B: approximate dirty beam of the combined observations at λ = 3.6 μm, together with a small inset of the uv points.
Current usage metrics show cumulative count of Article Views (full-text article views including HTML views, PDF and ePub downloads, according to the available data) and Abstracts Views on Vision4Press platform.
Data correspond to usage on the plateform after 2015. The current usage metrics is available 48-96 hours after online publication and is updated daily on week days.
Initial download of the metrics may take a while.