Fig. 1.
Download original image
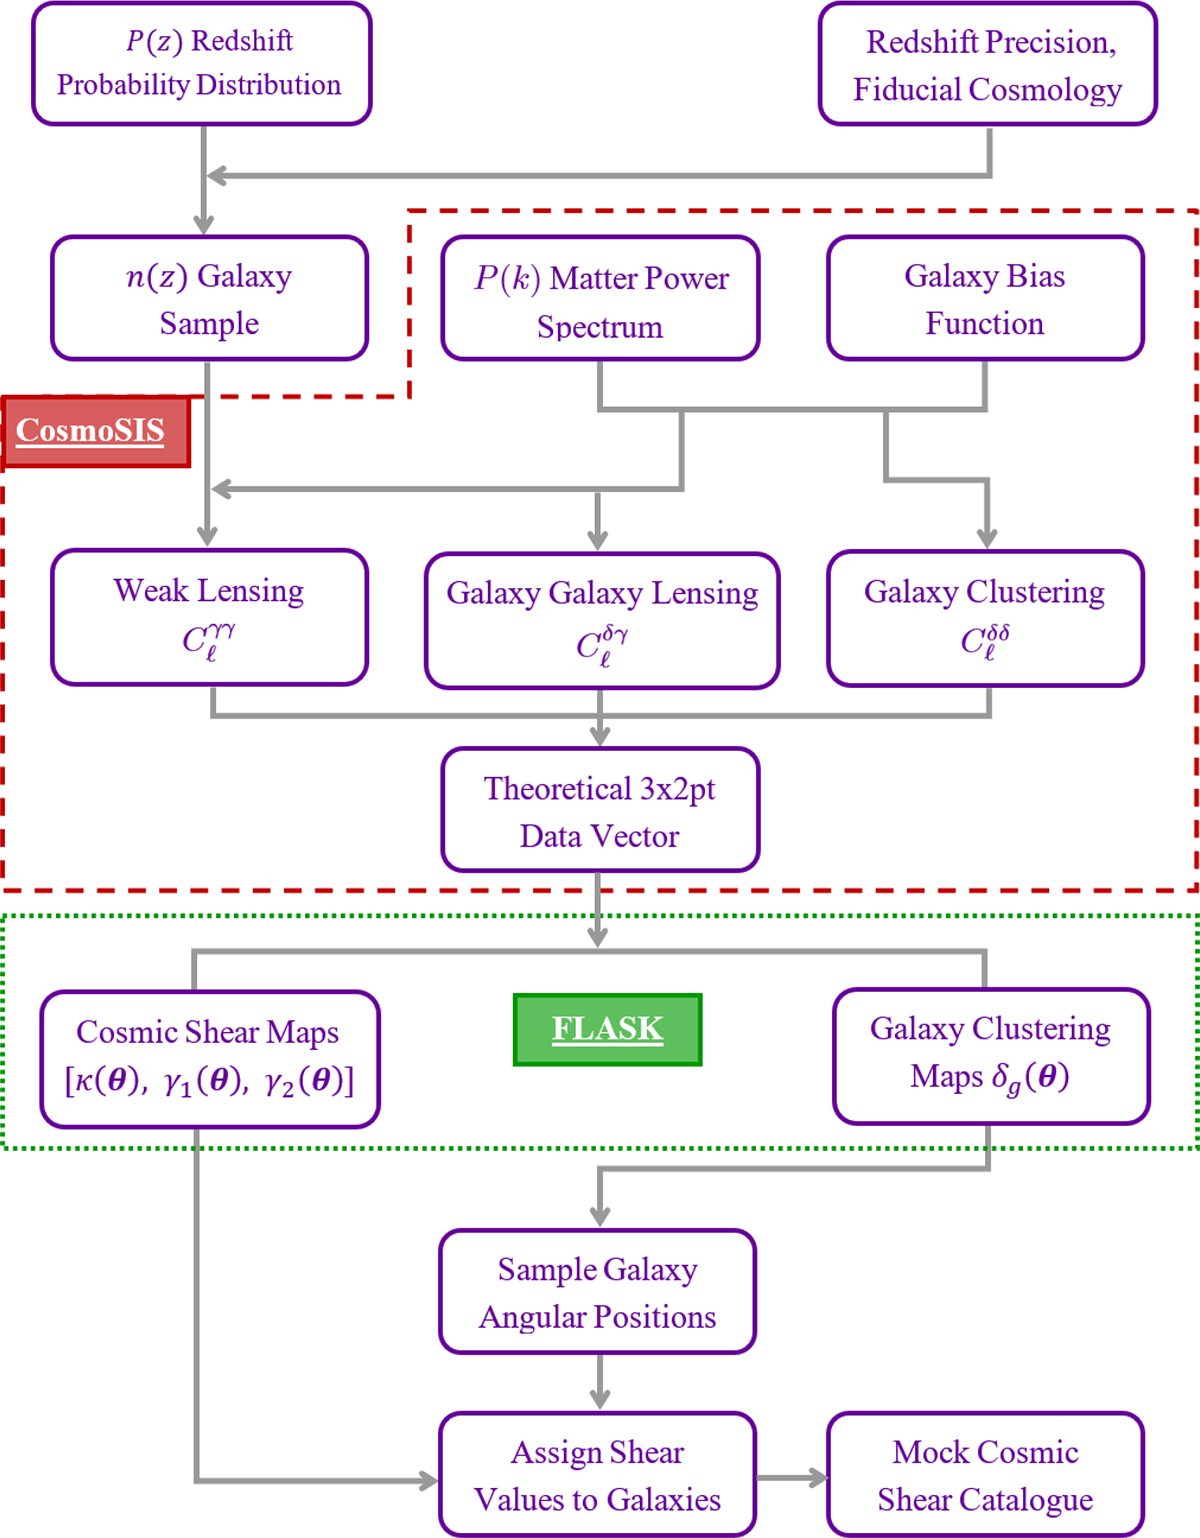
Flowchart describing the structure of our simulation to generate Stage IV-like mock galaxy catalogues from 2D realisations on the sky of the 3 × 2 pt signal that traces an underlying redshift distribution and fiducial cosmology. The red dashed and green dotted sections represent the simulation stages that are executed using CosmoSIS and FLASK, respectively.
Current usage metrics show cumulative count of Article Views (full-text article views including HTML views, PDF and ePub downloads, according to the available data) and Abstracts Views on Vision4Press platform.
Data correspond to usage on the plateform after 2015. The current usage metrics is available 48-96 hours after online publication and is updated daily on week days.
Initial download of the metrics may take a while.