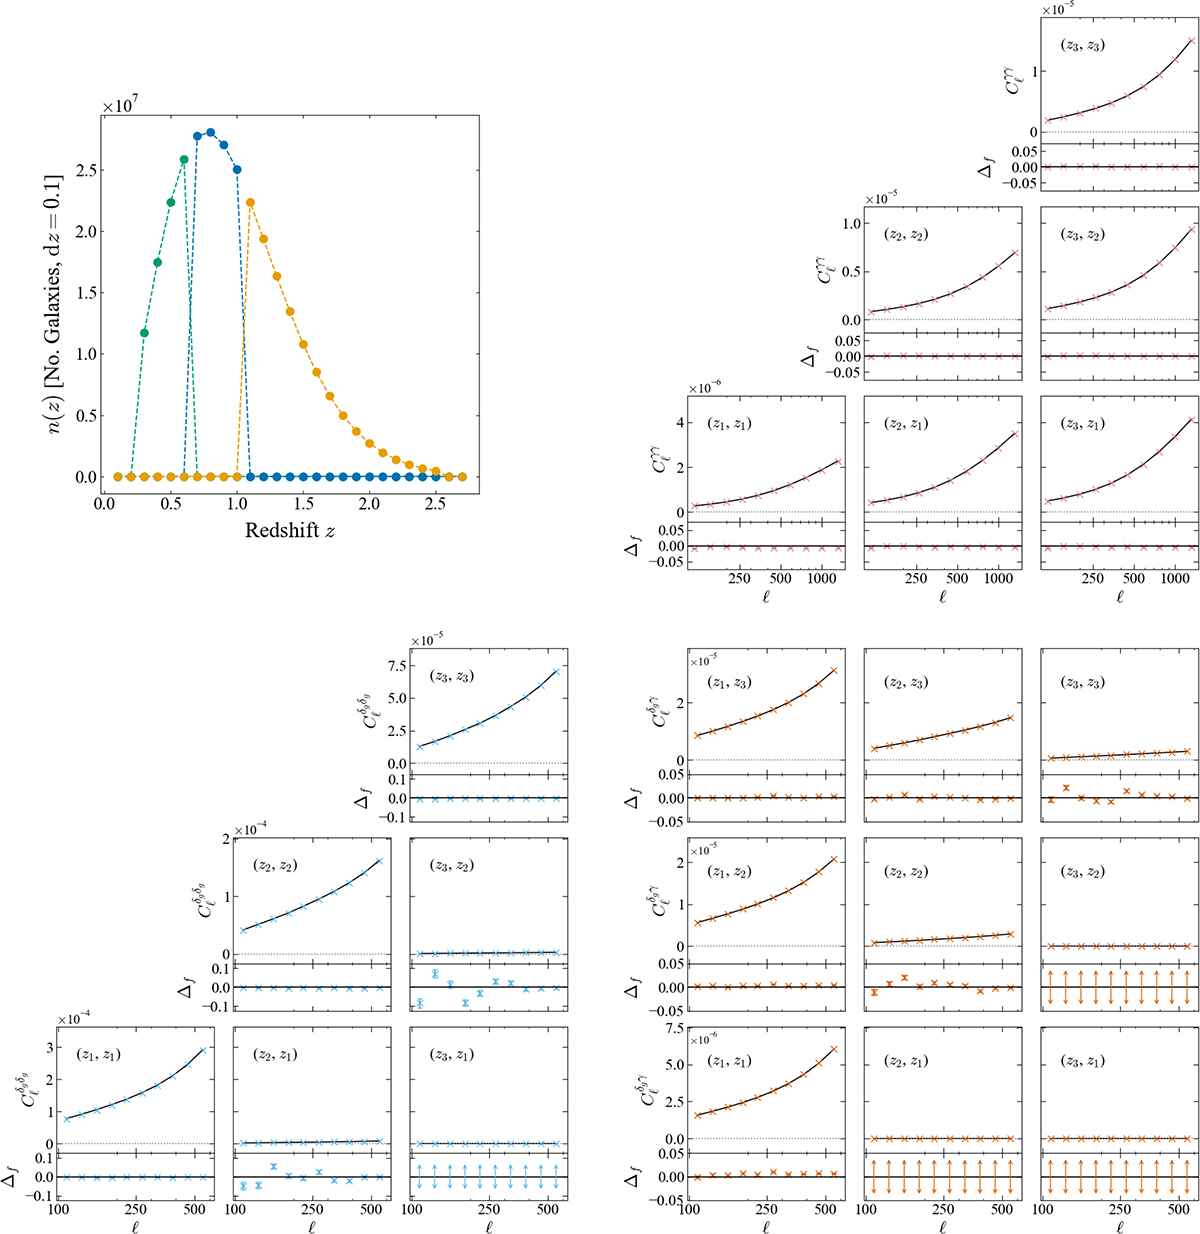
Fig. B.1.
Download original image
Top-left: Binned n(z) for a tomographic 3×2pt analysis of our mock catalogues using three equipopulated bins, with no contribution from shape noise or photo-z uncertainty in the simulation. Top-right, bottom-left, bottom-right: Measured 3×2pt Pseudo-Cℓ power spectra (cosmic shear, angular clustering, galaxy-galaxy lensing, respectively) measured over 3000 realisations for this chosen tomography, shown in crosses. We bin the power spectra into ten log-spaced bandpowers and measure the signal in the range 100 ≤ ℓ ≤ 1500 for cosmic shear, and 100 ≤ ℓ ≤ 600 for galaxy clustering and galaxy-galaxy lensing. The solid black lines show the input model power spectra. Beneath each individual power spectrum we plot the normalised residuals of the data, defined as the fractional quantity (![]() , which we denote as Δf on the y-axis label. The vertical double-headed arrows in the off-diagonal subplots indicate that the fractional residuals, and their errors, for these spectra are extremely large due to the division by an extremely small signal.
, which we denote as Δf on the y-axis label. The vertical double-headed arrows in the off-diagonal subplots indicate that the fractional residuals, and their errors, for these spectra are extremely large due to the division by an extremely small signal.
Current usage metrics show cumulative count of Article Views (full-text article views including HTML views, PDF and ePub downloads, according to the available data) and Abstracts Views on Vision4Press platform.
Data correspond to usage on the plateform after 2015. The current usage metrics is available 48-96 hours after online publication and is updated daily on week days.
Initial download of the metrics may take a while.