Fig. B.2.
Download original image
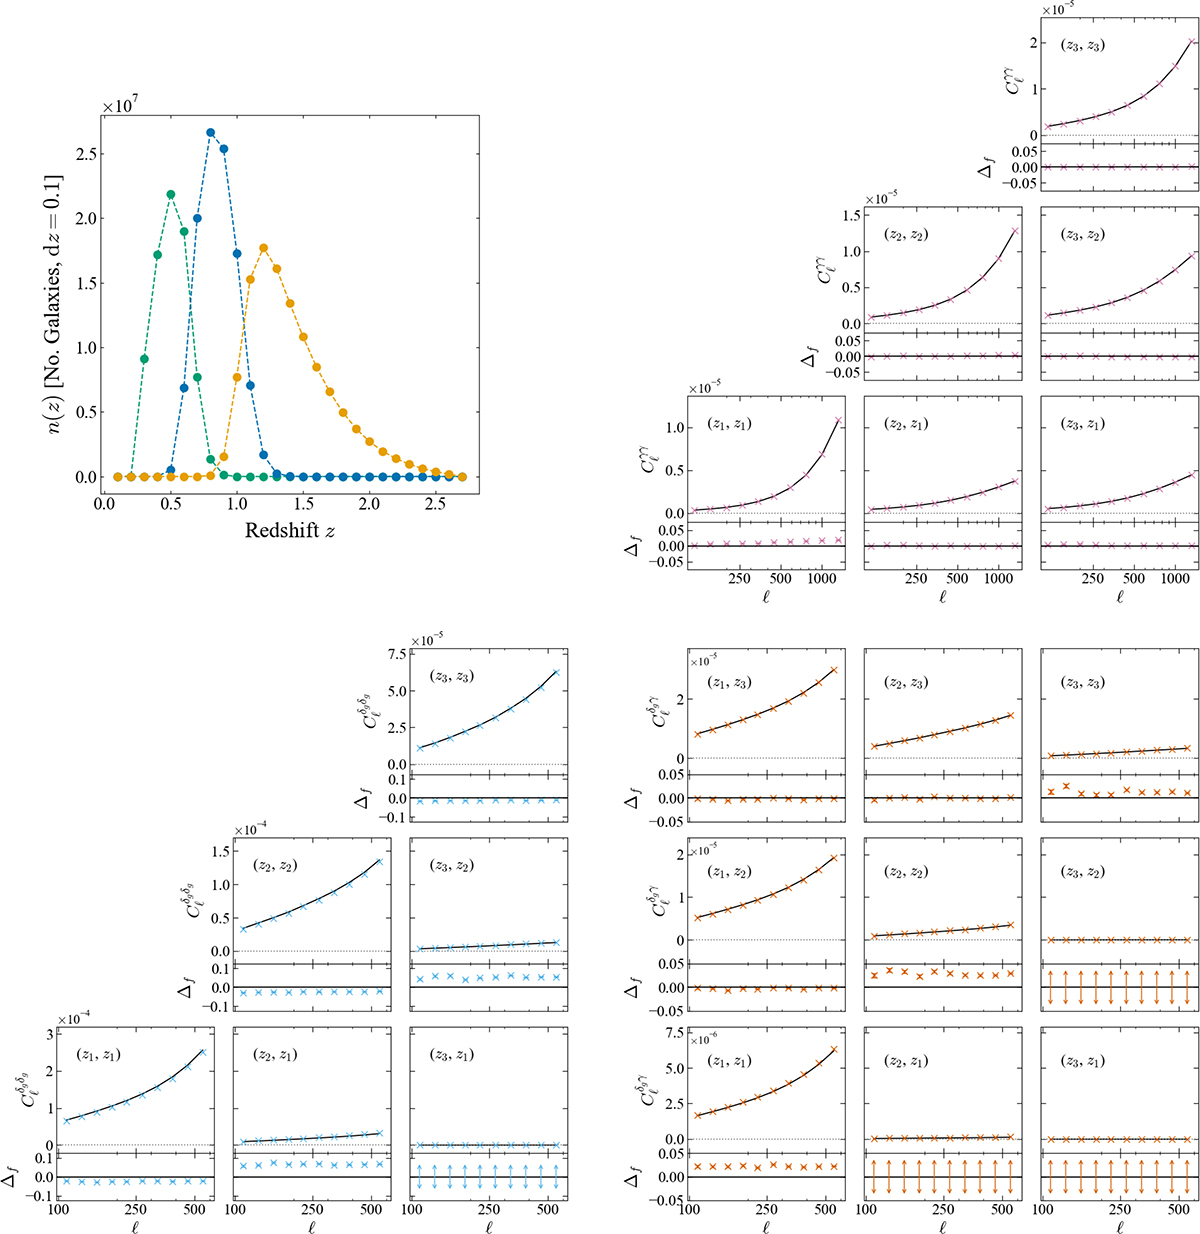
Top-left: Binned n(z) for a three equipopulated bin tomographic set-up, measured from our mock catalogues that include realistic Gaussian shape noise and photo-z uncertainties in the simulation. Top-right, bottom-left, bottom-right: Cosmic shear, angular clustering, and galaxy-galaxy lensing components (respectively) of the 3×2pt data vector. We show in crosses the Pseudo-Cℓ power spectra measured over 3000 realisations of our simulation for this chosen tomography. We bin the multipoles into ten log-spaced bandpowers and measure the signal in the range 100 ≤ ℓ ≤ 1500 for cosmic shear, and 100 ≤ ℓ ≤ 600 for galaxy clustering and galaxy-galaxy lensing. We plot the theoretical prediction in black alongside the measured data, and underneath each individual power spectrum we plot the normalised residuals, which we define as the fractional quantity (![]() , denoted as Δf on the y-axis label.
, denoted as Δf on the y-axis label.
Current usage metrics show cumulative count of Article Views (full-text article views including HTML views, PDF and ePub downloads, according to the available data) and Abstracts Views on Vision4Press platform.
Data correspond to usage on the plateform after 2015. The current usage metrics is available 48-96 hours after online publication and is updated daily on week days.
Initial download of the metrics may take a while.