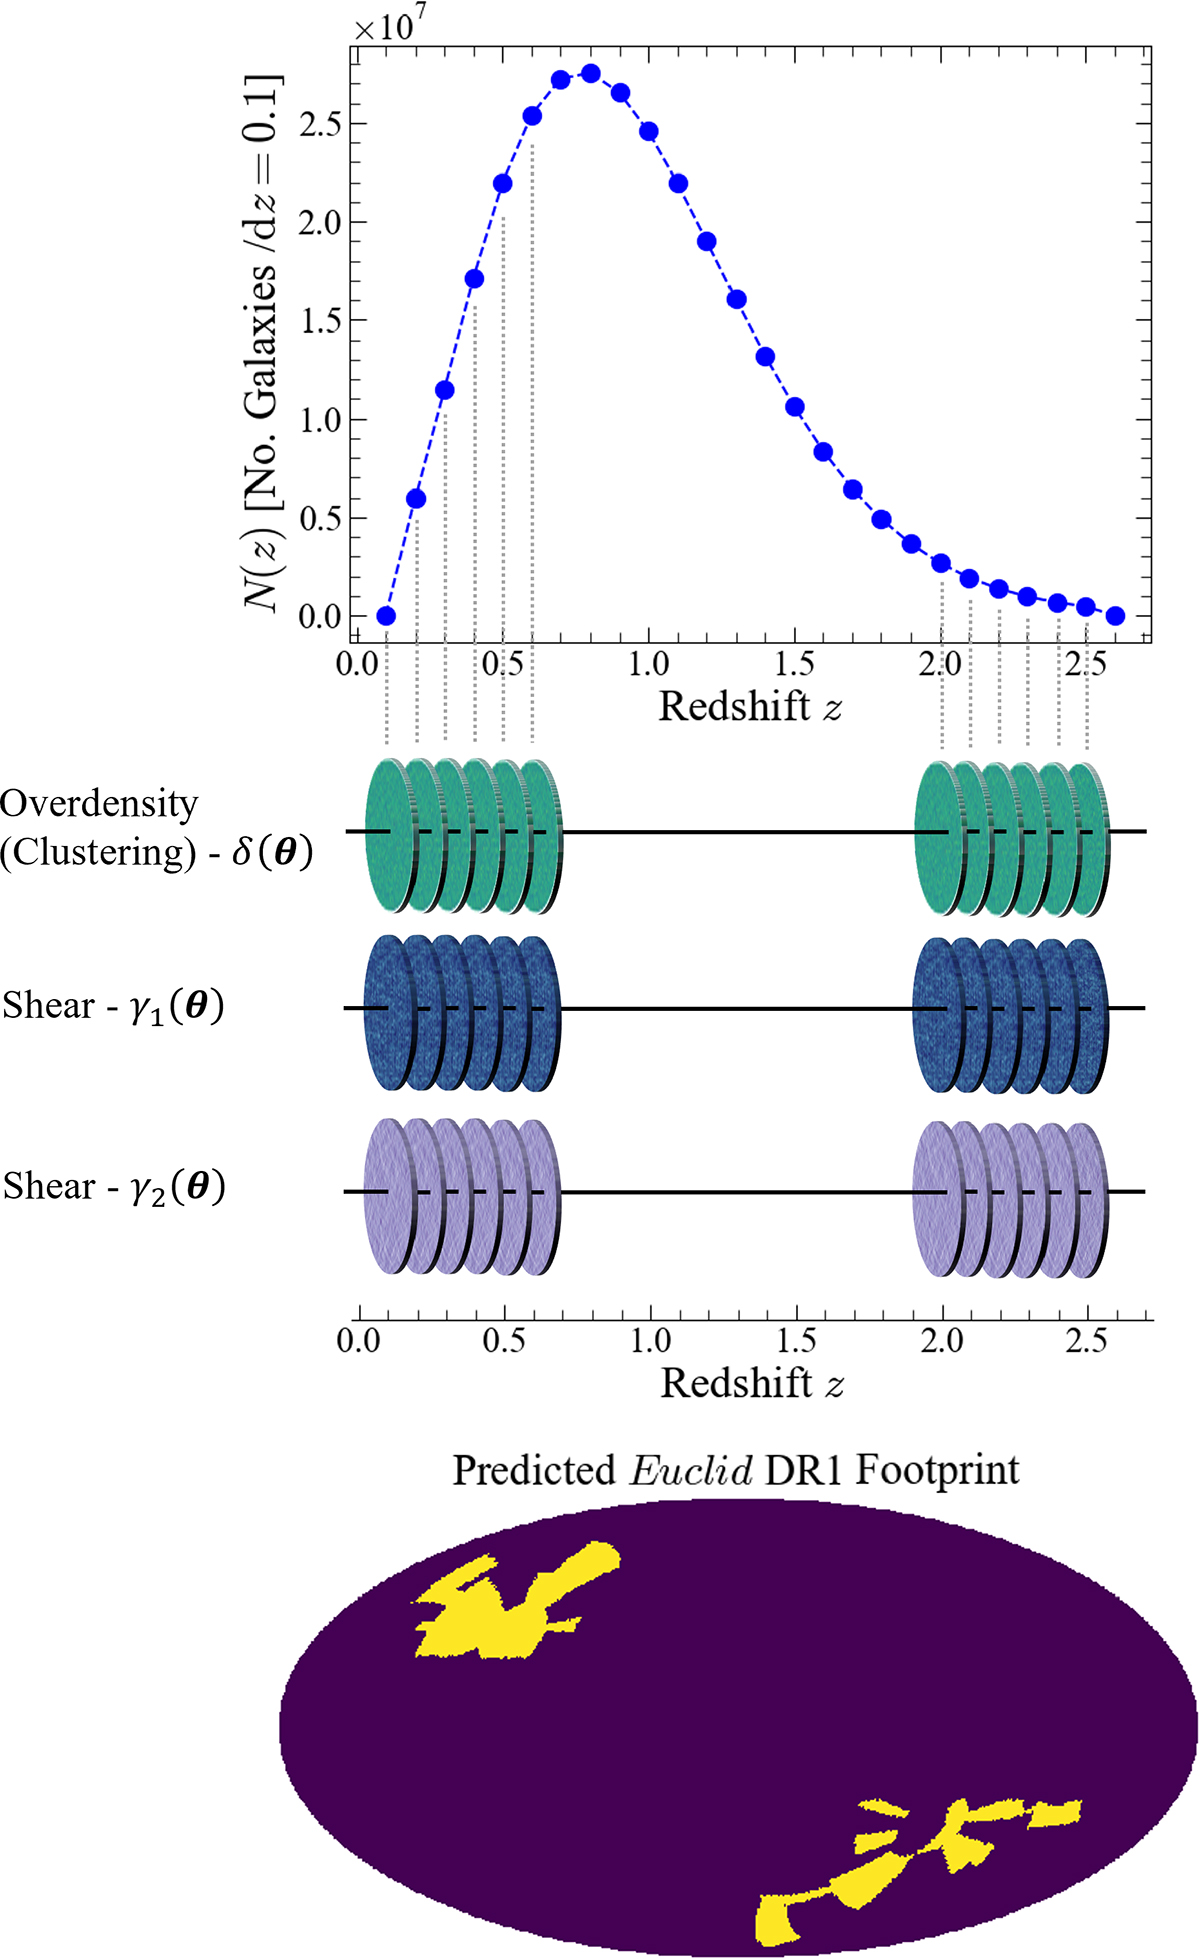
Fig. 2.
Download original image
Illustration of the method used to simulate a mock weak lensing survey. 2D maps of the correlated 3 × 2 pt fields are generated at finely sampled points in redshift. These 2D maps are used to approximate the full 3D cosmological information of the 3 × 2 pt signal. From the overdensity fields, we Poisson sample a galaxy population that traces the underlying n(z) distribution. We then assign the correlated weak lensing observables to each galaxy from the shear field values at the galaxy’s angular position on the sky at a given redshift. We show an early approximation of the Euclid DR1 footprint at the bottom of the figure which we have used to create our Euclid-like simulations. The ‘observed’ region is shown in yellow. Note: the actual Euclid DR1 footprint will be significantly different to that shown here.
Current usage metrics show cumulative count of Article Views (full-text article views including HTML views, PDF and ePub downloads, according to the available data) and Abstracts Views on Vision4Press platform.
Data correspond to usage on the plateform after 2015. The current usage metrics is available 48-96 hours after online publication and is updated daily on week days.
Initial download of the metrics may take a while.