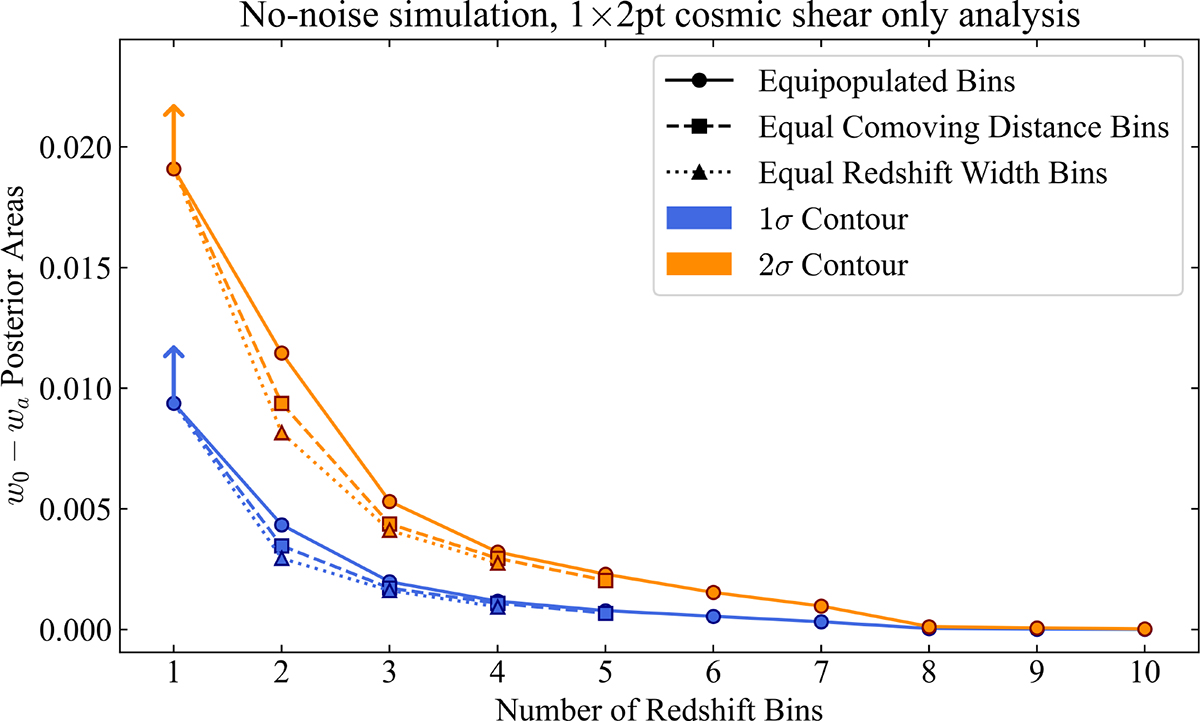
Fig. 3.
Download original image
Areas enclosed by the 1σ (Blue) and 2σ contours in the (w0, wa) plane, for different numbers of redshift bins used in a tomographic analysis of the cosmic shear signal measured from 3000 realisations of our simulation. We show in circular markers joined with solid lines the areas measured for the equipopulated binning choice; in square markers joined with dashed lines the equal comoving distance bins; and in triangular markers joined with dotted lines the equal redshift width binning choice. Since the cosmic shear component alone is relatively weakly constraining, the 1 bin measurement does not yield a closed contour in (w0, wa) within the ranges of the parameter grid. Hence, the data point for this case represents a lower bound of the true value, which we represent by using a vertical arrow.
Current usage metrics show cumulative count of Article Views (full-text article views including HTML views, PDF and ePub downloads, according to the available data) and Abstracts Views on Vision4Press platform.
Data correspond to usage on the plateform after 2015. The current usage metrics is available 48-96 hours after online publication and is updated daily on week days.
Initial download of the metrics may take a while.