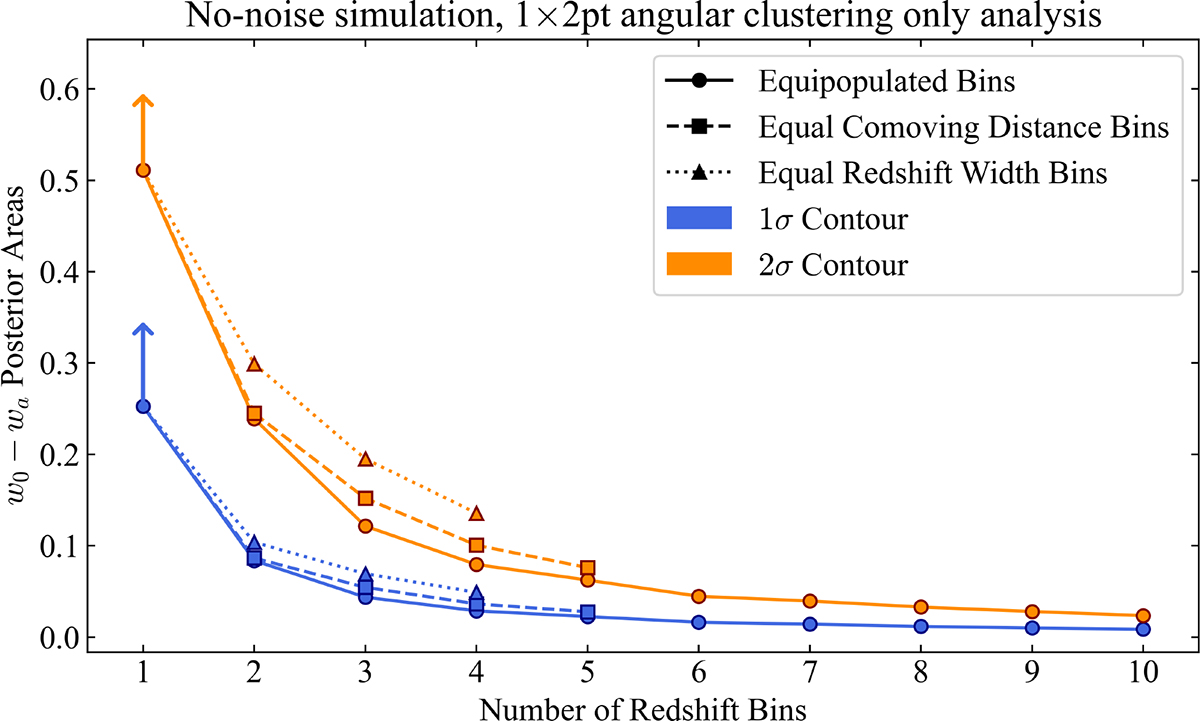
Fig. 4.
Download original image
Contour areas of the 1 and 2σ constraints on (w0, wa), measured from the tomographic angular clustering component of our no-noise simulation. We plot the contour areas measured as a function of the number of redshift bins used in a tomographic analysis, considering the equipopulated, equal comoving distance, equally spaced in redshift binning strategies. The 1 bin measurement does not sufficiently constrain either parameter within the prior volume, hence we include a vertical arrow to denote that this data point is a lower bound.
Current usage metrics show cumulative count of Article Views (full-text article views including HTML views, PDF and ePub downloads, according to the available data) and Abstracts Views on Vision4Press platform.
Data correspond to usage on the plateform after 2015. The current usage metrics is available 48-96 hours after online publication and is updated daily on week days.
Initial download of the metrics may take a while.