Open Access
Fig. A.1
Download original image
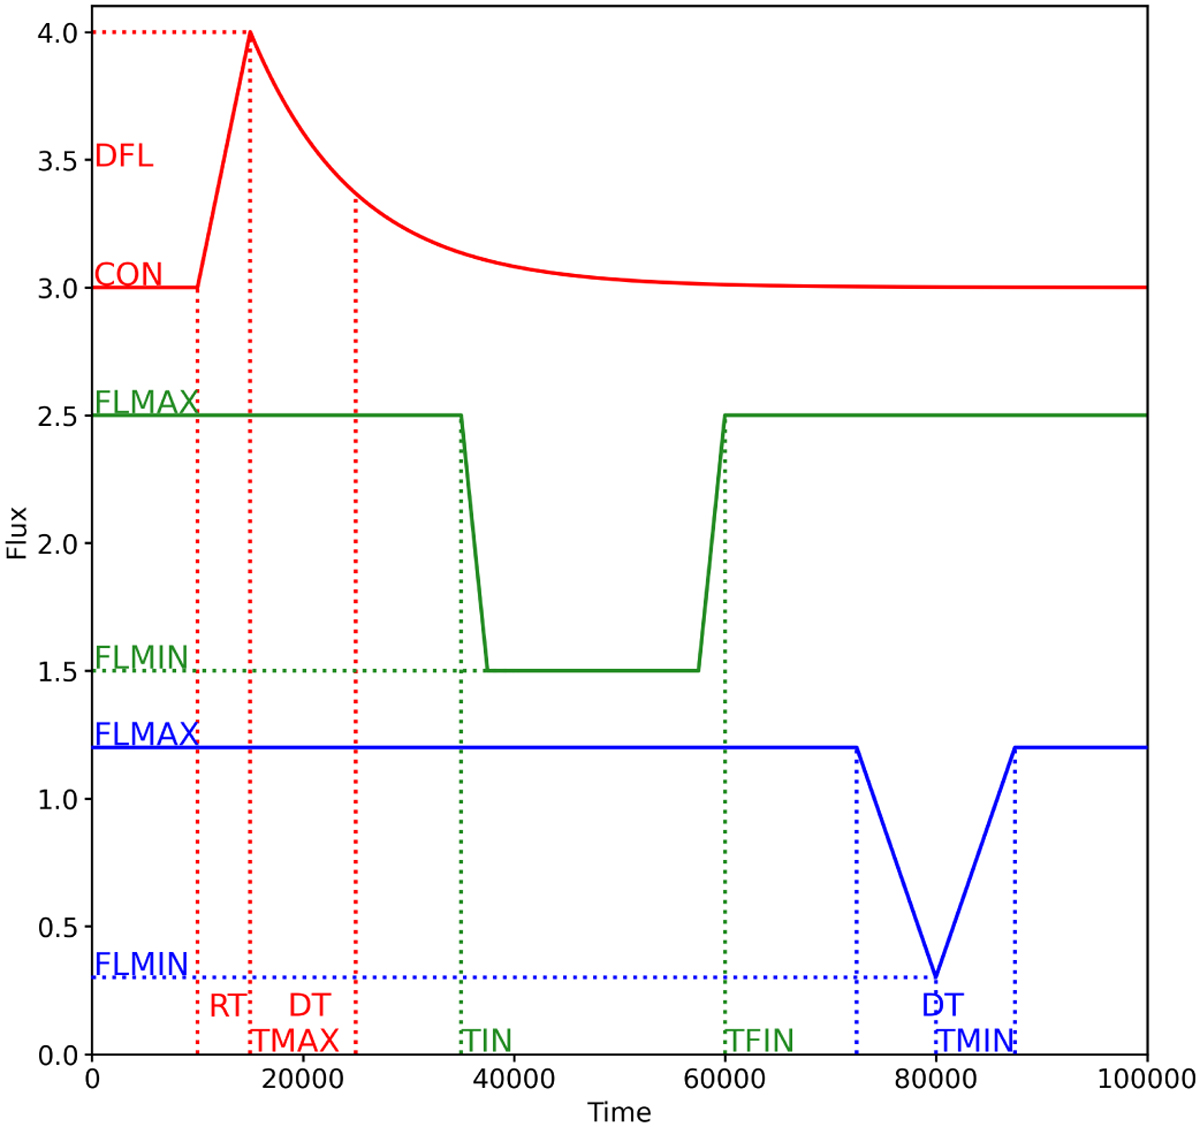
Example of three of the models we fit, with the associated features. We show in red the flare model, in green the single eclipse model and in blue the single dip model.
Current usage metrics show cumulative count of Article Views (full-text article views including HTML views, PDF and ePub downloads, according to the available data) and Abstracts Views on Vision4Press platform.
Data correspond to usage on the plateform after 2015. The current usage metrics is available 48-96 hours after online publication and is updated daily on week days.
Initial download of the metrics may take a while.