Fig. A.2
Download original image
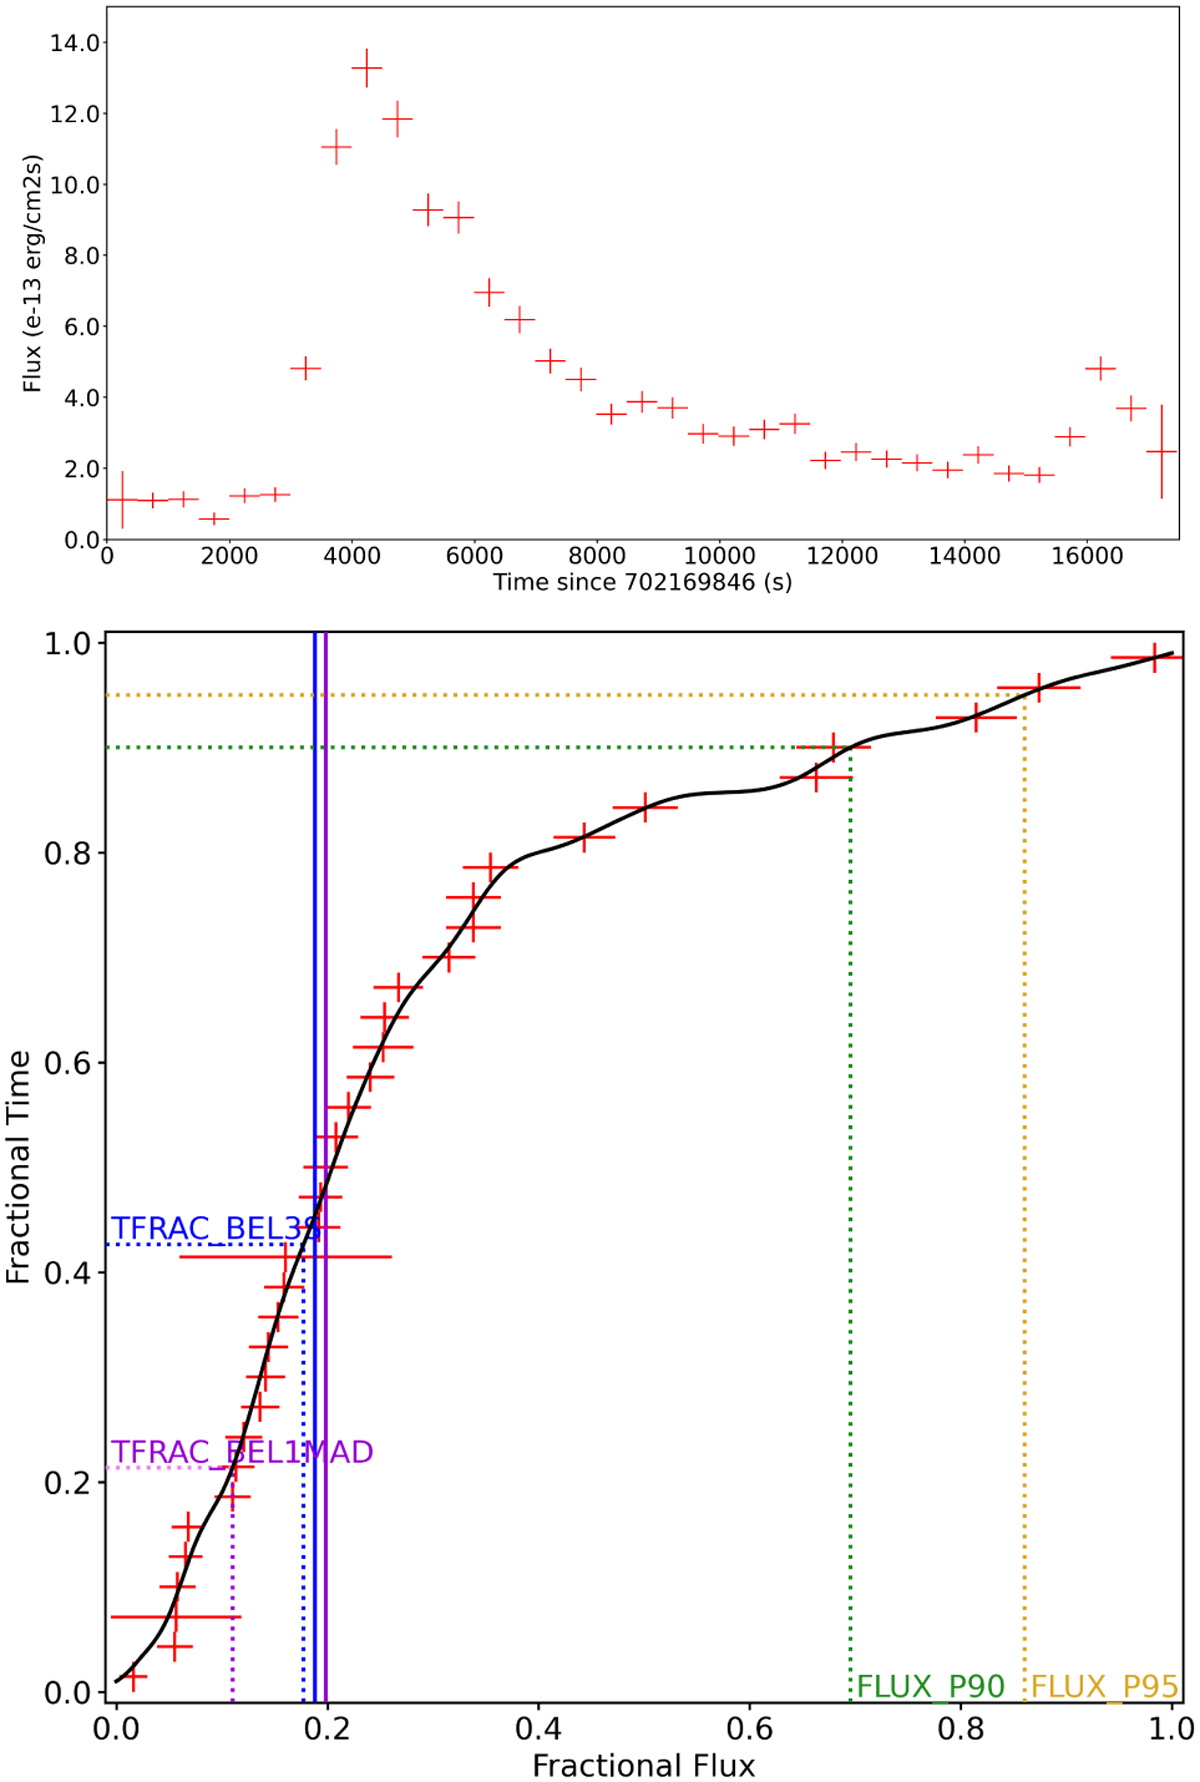
Example of a flaring LC (top) with the associated CDF (bottom). The original discrete CDF is shown in red, the continuous CDF in black; in blue and violet we show, respectively, the weighted average and the median of the LC. We also show some of the CDF features we use: TFRAC_BEL1MAD, TFRAC_BEL3S, FLUX_90 and FLUX_95 (respectively, in violet, blue, green, and orange).
Current usage metrics show cumulative count of Article Views (full-text article views including HTML views, PDF and ePub downloads, according to the available data) and Abstracts Views on Vision4Press platform.
Data correspond to usage on the plateform after 2015. The current usage metrics is available 48-96 hours after online publication and is updated daily on week days.
Initial download of the metrics may take a while.