Fig. 2
Download original image
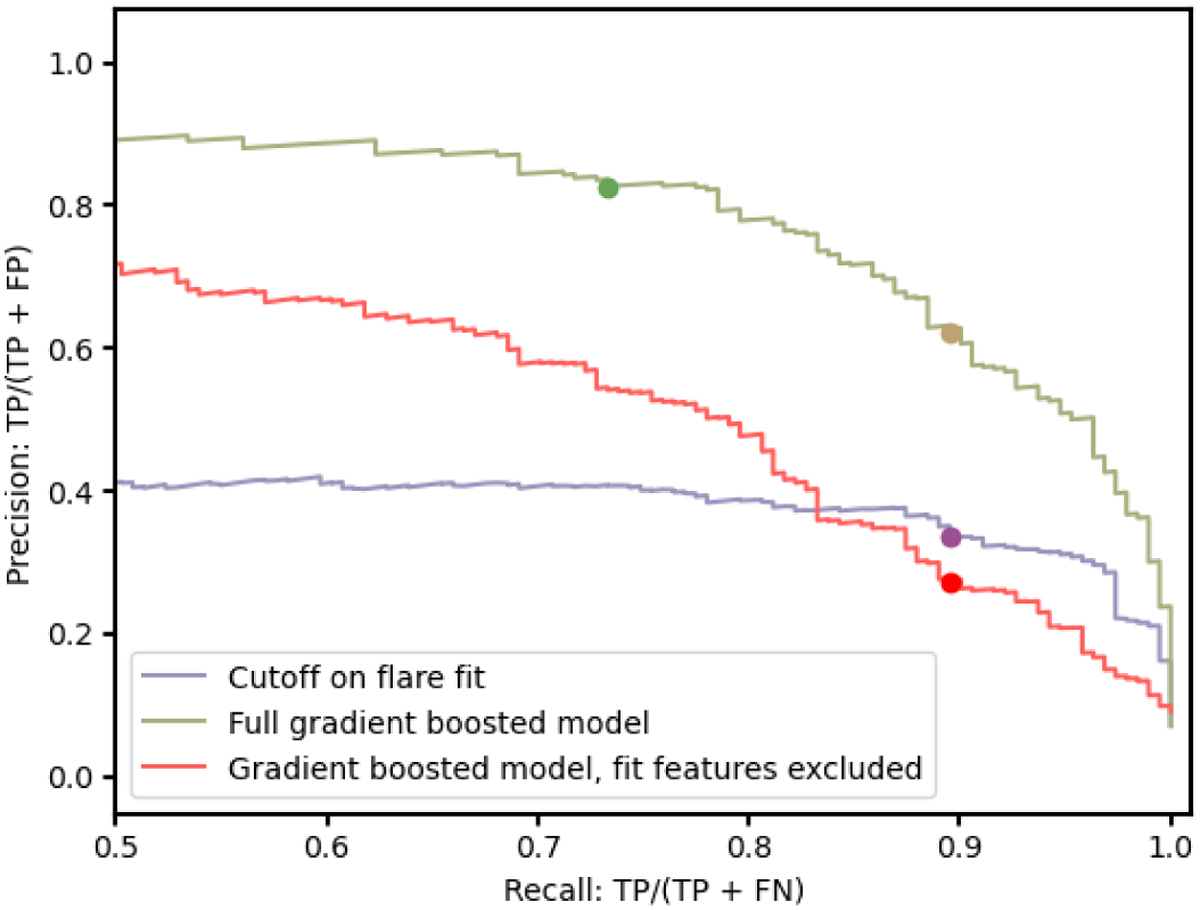
Precision-recall curves for setting a cutoff on F_NSIGMA_FLCON (purple), with the brighter purple dot corresponding to a five-sigma cutoff. The green curve corresponds to our best gradient boosting model (including all features), with the brighter green dot corresponding to a threshold of 0.5. The brown dot on this curve corresponds to the level of precision that would be reached at the higher recall reached by the five-sigma cutoff on F_NSIGMA_FLCON. The red curve corresponds to a gradient boosting model including only features that do not derive from fitting physically meaningful templates to the light curve (such as flares, dips, eclipses, etc.), and the brighter red dot corresponds to the level of precision that would be reached at the recall reached by the five-sigma cutoff on F_NSIGMA_FLCON.
Current usage metrics show cumulative count of Article Views (full-text article views including HTML views, PDF and ePub downloads, according to the available data) and Abstracts Views on Vision4Press platform.
Data correspond to usage on the plateform after 2015. The current usage metrics is available 48-96 hours after online publication and is updated daily on week days.
Initial download of the metrics may take a while.