Open Access
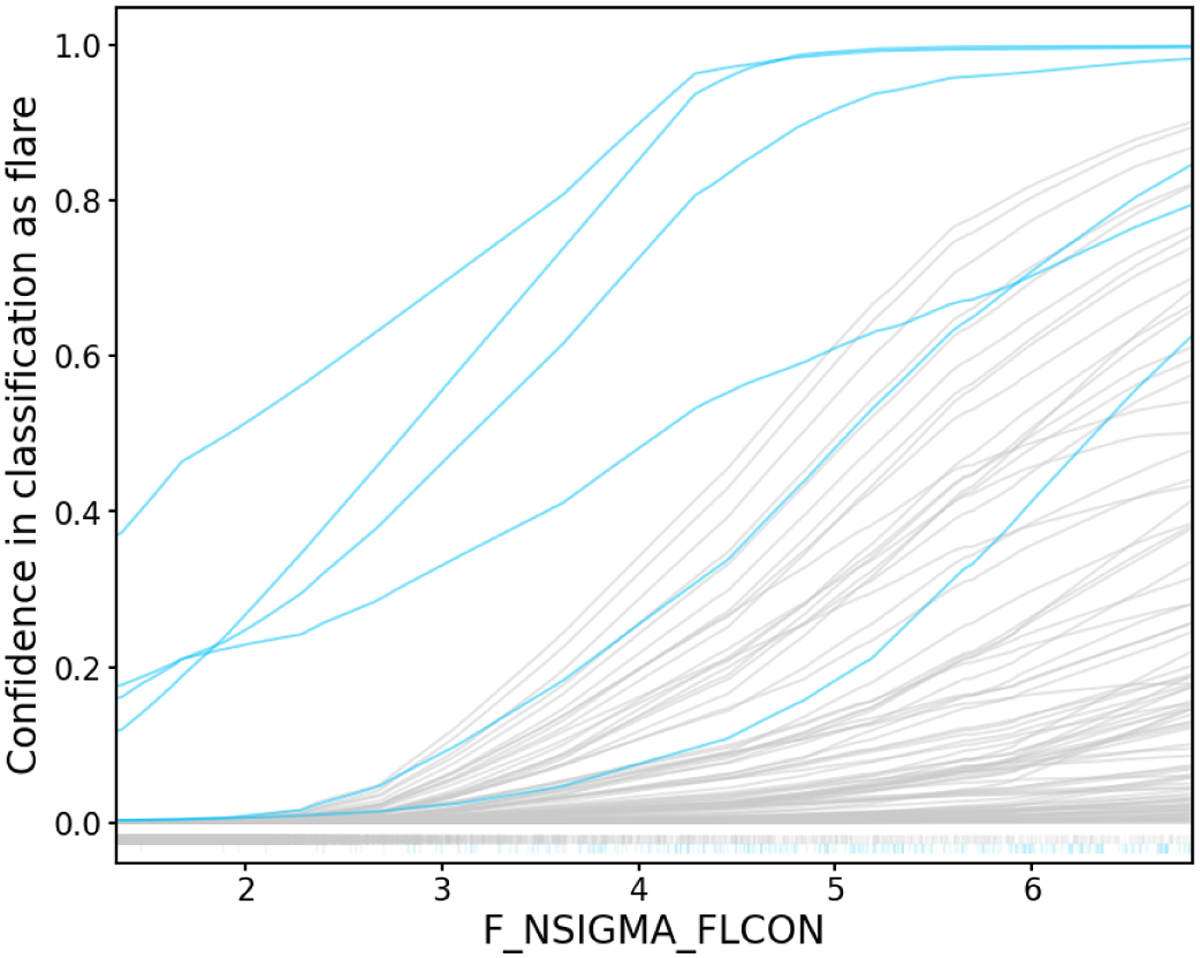
Fig. 5
Download original image
ICE plot for F_NSIGMA_FLCON. Curves for 100 randomly chosen sources are shown. Non-flare sources are shown in gray, flares in cerulean blue. At the bottom a rug plot shows the actual values of the feature taken on by flares (cerulean blue) and non-flares (gray).
Current usage metrics show cumulative count of Article Views (full-text article views including HTML views, PDF and ePub downloads, according to the available data) and Abstracts Views on Vision4Press platform.
Data correspond to usage on the plateform after 2015. The current usage metrics is available 48-96 hours after online publication and is updated daily on week days.
Initial download of the metrics may take a while.