Fig. 10.
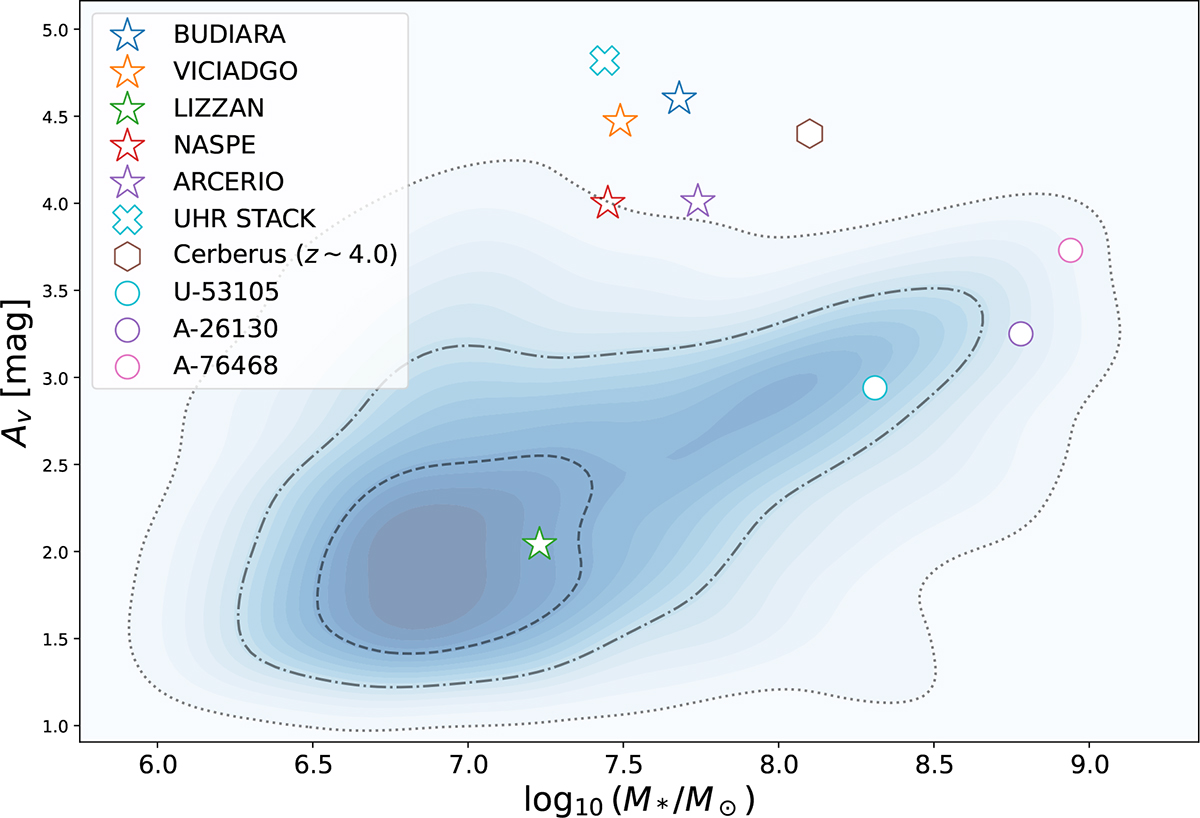
Download original image
Comparison between the 4141 sources in the CEERS HELM galaxy sample by Bisigello et al. (2025) and the HELM solutions retrieved in this work in the form of a logarithmic stellar mass versus dust attenuation index plot. Blue contours represent isodensity lines in the distribution of the updated CEERS HELM galaxy sample by Bisigello et al. (2025). The dashed, dash-dotted, and dotted black lines are enclosing, respectively, 50%, 80%, and 95% of the total HELM distribution. Colored star markers represent our UHR candidates adopting their z ≤ 8 solutions, with their median stack being represented by a cyan cross. The three colored circles instead represent our strongest HELM candidates discussed in Sect. 7.5. Finally, the brown hexagon represents the best-fit stellar mass and dust attenuation index for the NIRCam-dark “Cerberus” galaxy (Pérez-González et al. 2024b) in its z ∼ 4 solution (fitting with the synthesizer-AGN code and adopting a double-exponential SFH with a Calzetti dust attenuation law).
Current usage metrics show cumulative count of Article Views (full-text article views including HTML views, PDF and ePub downloads, according to the available data) and Abstracts Views on Vision4Press platform.
Data correspond to usage on the plateform after 2015. The current usage metrics is available 48-96 hours after online publication and is updated daily on week days.
Initial download of the metrics may take a while.