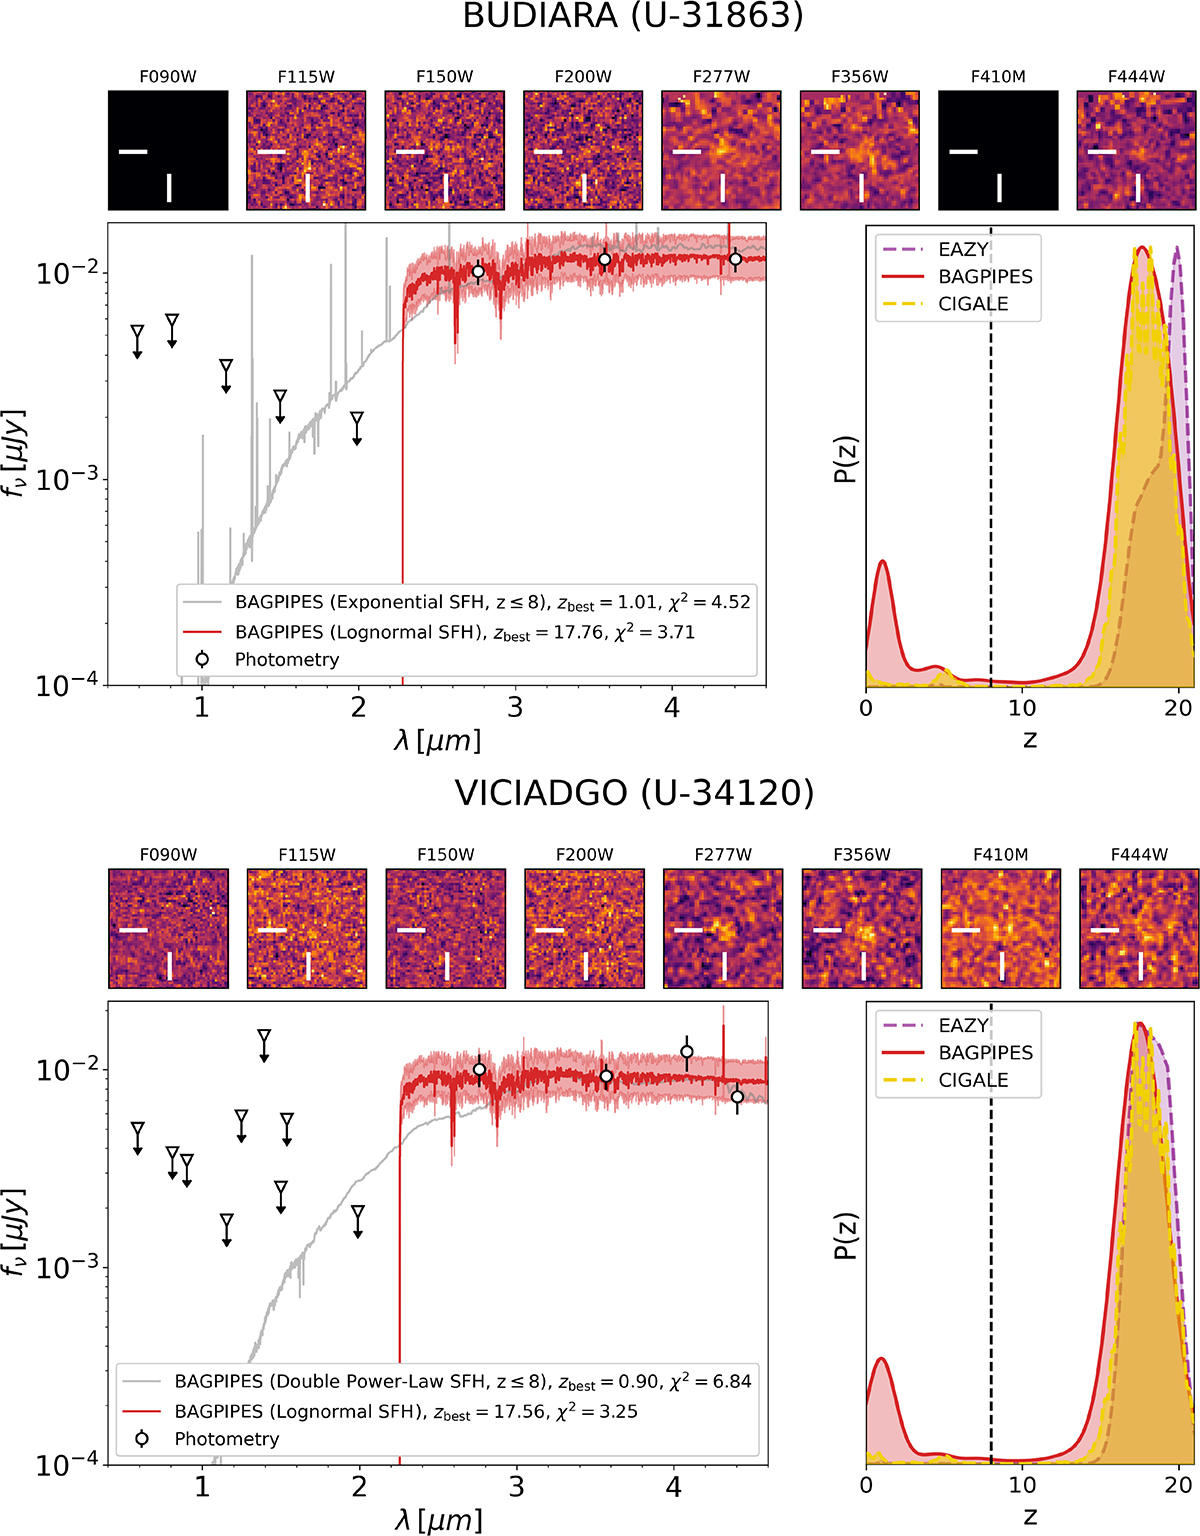
Fig. D.1.
Download original image
Best-fit SEDs and redshift probability distributions P(z) obtained with the procedure described in Sect. 5 for the UHR galaxy candidates and their median stack. The top section of each panel shows 1.5″×1.5″ NIRCam cutouts of the source. The left inset displays the observed photometry (black circles) with 1σ upper-limit uncertainties (black triangles). The Bagpipes best-fit SED at z > 8 is shown in red, with its 0.1 dex confidence interval (shaded red area), while the best-fit SED at z ≤ 8 – obtained independently over the same full prior range – is shown in gray. The right inset reports the normalized redshift probability distributions from different SED-fitting codes: the P(z) of the Bagpipes model that minimizes χ2 at z > 8, shown in red over the full prior range (0 ≤ z ≤ 25); the CIGALE posterior (dashed yellow line); and the mean EAZY posterior averaged over all templates described in Sect. 5 (purple). The vertical dashed black line marks the z = 8 threshold.
Current usage metrics show cumulative count of Article Views (full-text article views including HTML views, PDF and ePub downloads, according to the available data) and Abstracts Views on Vision4Press platform.
Data correspond to usage on the plateform after 2015. The current usage metrics is available 48-96 hours after online publication and is updated daily on week days.
Initial download of the metrics may take a while.