Fig. E.1.
Download original image
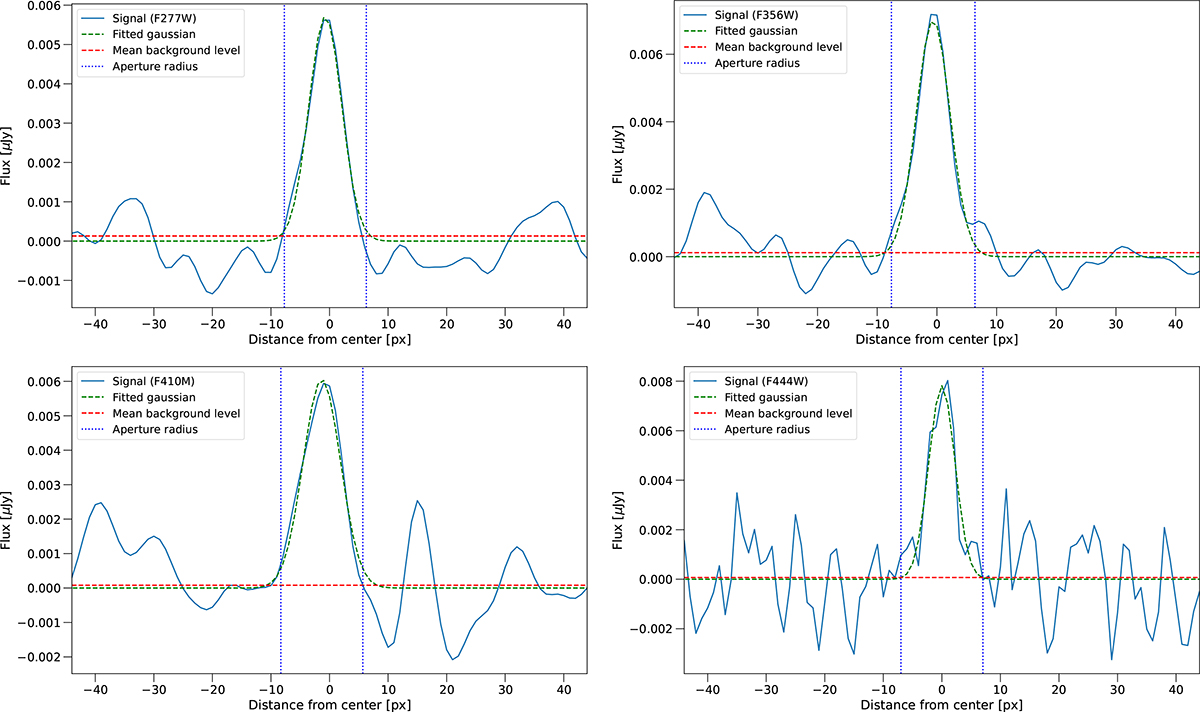
Signal in the convolved long-wavelength NIRCam cutouts is shown for our stacked UHR candidate sample, with insets corresponding to F277W (top left), F356W (top right), F410M (bottom left), and F444W (bottom right). The blue line represents the signal, in μJy, for each pixel in the stacked image as a function of its distance from the center of the cutout (measured in pixels). A dashed green line depicts the Gaussian fit used to estimate the aperture photometry radius, while a dashed red line indicates the mean background level. The vertical dashed blue lines mark the inferred radius for fiducial aperture photometry.
Current usage metrics show cumulative count of Article Views (full-text article views including HTML views, PDF and ePub downloads, according to the available data) and Abstracts Views on Vision4Press platform.
Data correspond to usage on the plateform after 2015. The current usage metrics is available 48-96 hours after online publication and is updated daily on week days.
Initial download of the metrics may take a while.