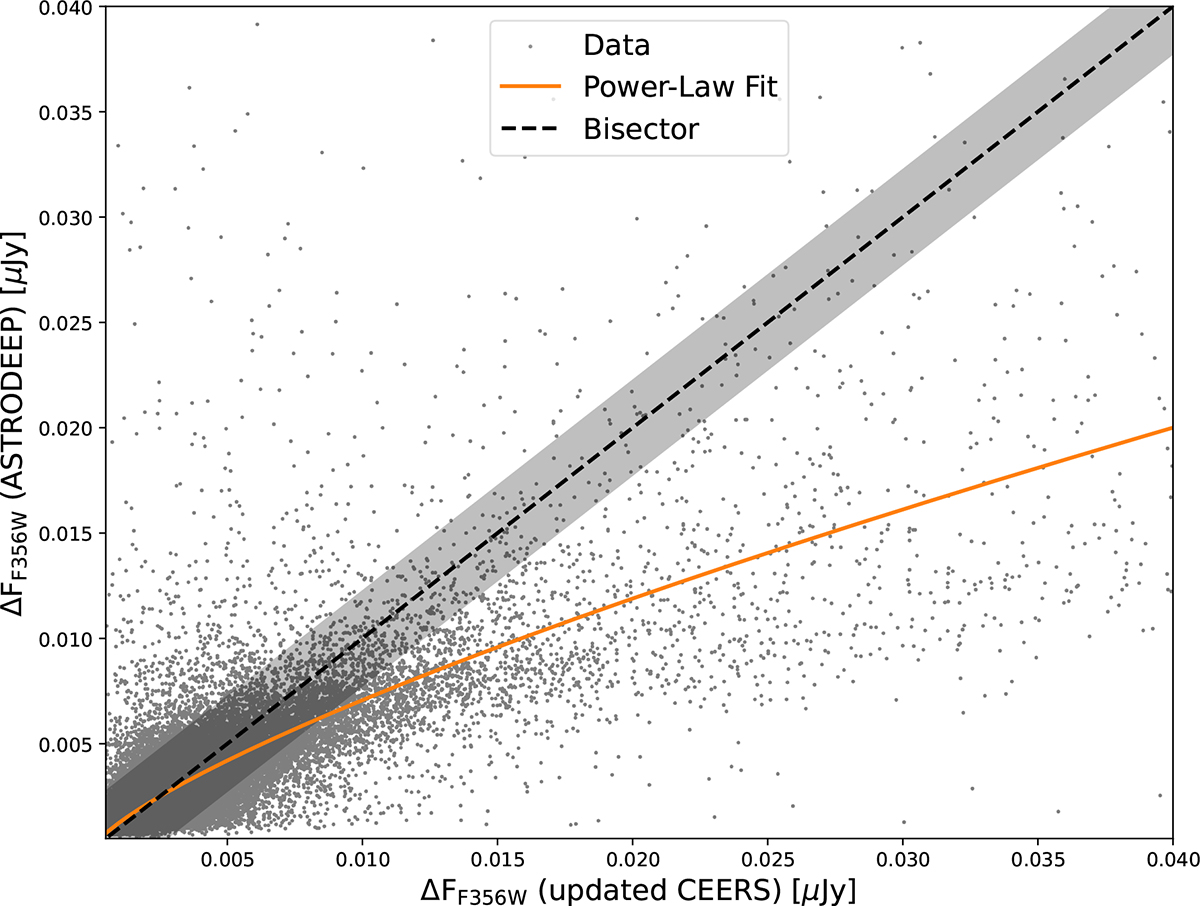
Fig. 2.
Download original image
Updated CEERS catalog photometry errors vs. CEERS ASTRODEEP-JWST photometry errors for the sources in common between the two catalogs (displayed as gray dots) for a sample band (F356W). The bisector of the plot is represented as a dashed black line surrounded by a 1σ confidence interval (shaded black area) representing the typical dispersion of the data points around the bisector. A power-law fit is displayed to showcase how the updated CEERS catalog’s errors tend to be higher with respect to CEERS ASTRODEEP-JWST ones.
Current usage metrics show cumulative count of Article Views (full-text article views including HTML views, PDF and ePub downloads, according to the available data) and Abstracts Views on Vision4Press platform.
Data correspond to usage on the plateform after 2015. The current usage metrics is available 48-96 hours after online publication and is updated daily on week days.
Initial download of the metrics may take a while.