Fig. 3.
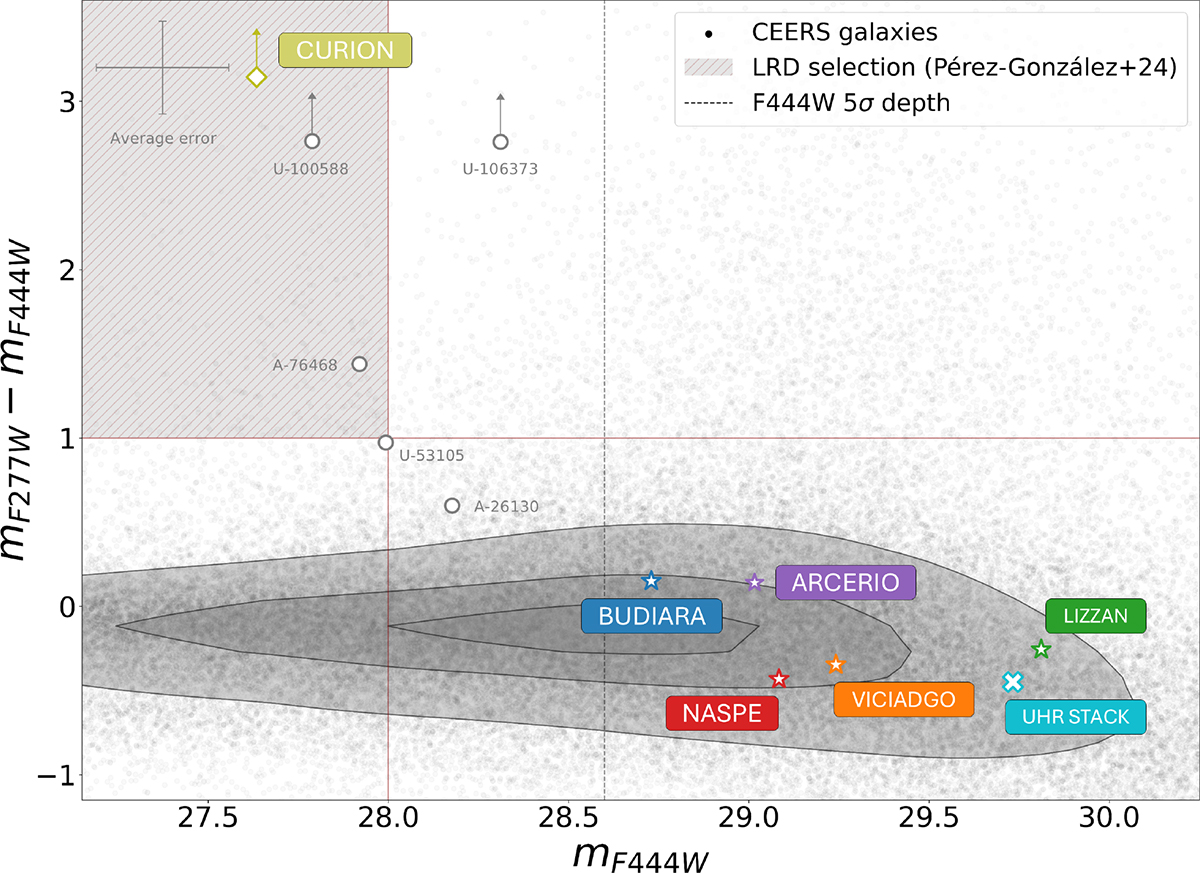
Download original image
[F277W – F444W] color-magnitude diagram for our F200W dropouts. The F200W-dropout sample’s objects are shown as colored stars (UHR candidates), pea green diamond (CURION, a strong line emitter), cyan cross (stacked UHR galaxies) or gray circles (all other objects in the sample). For CURION, U-100588 and U-106373 we report 1σ upper limits. Black dots in the background represent the colors of CEERS galaxies, with shaded gray contours enclosing 50% (inner), 80% (middle), and 95% (outer) of the total CEERS source density. The F444W 5σ depth is marked as a dashed black line, while the shaded brown area represents the color-magnitude space occupied by LRDs in Pérez-González et al. (2024a, albeit such a selection also requires F150W–F200W < 0.5). Gray error bars represent the average errors for objects with colors that are not upper limits.
Current usage metrics show cumulative count of Article Views (full-text article views including HTML views, PDF and ePub downloads, according to the available data) and Abstracts Views on Vision4Press platform.
Data correspond to usage on the plateform after 2015. The current usage metrics is available 48-96 hours after online publication and is updated daily on week days.
Initial download of the metrics may take a while.