Fig. 4.
Download original image
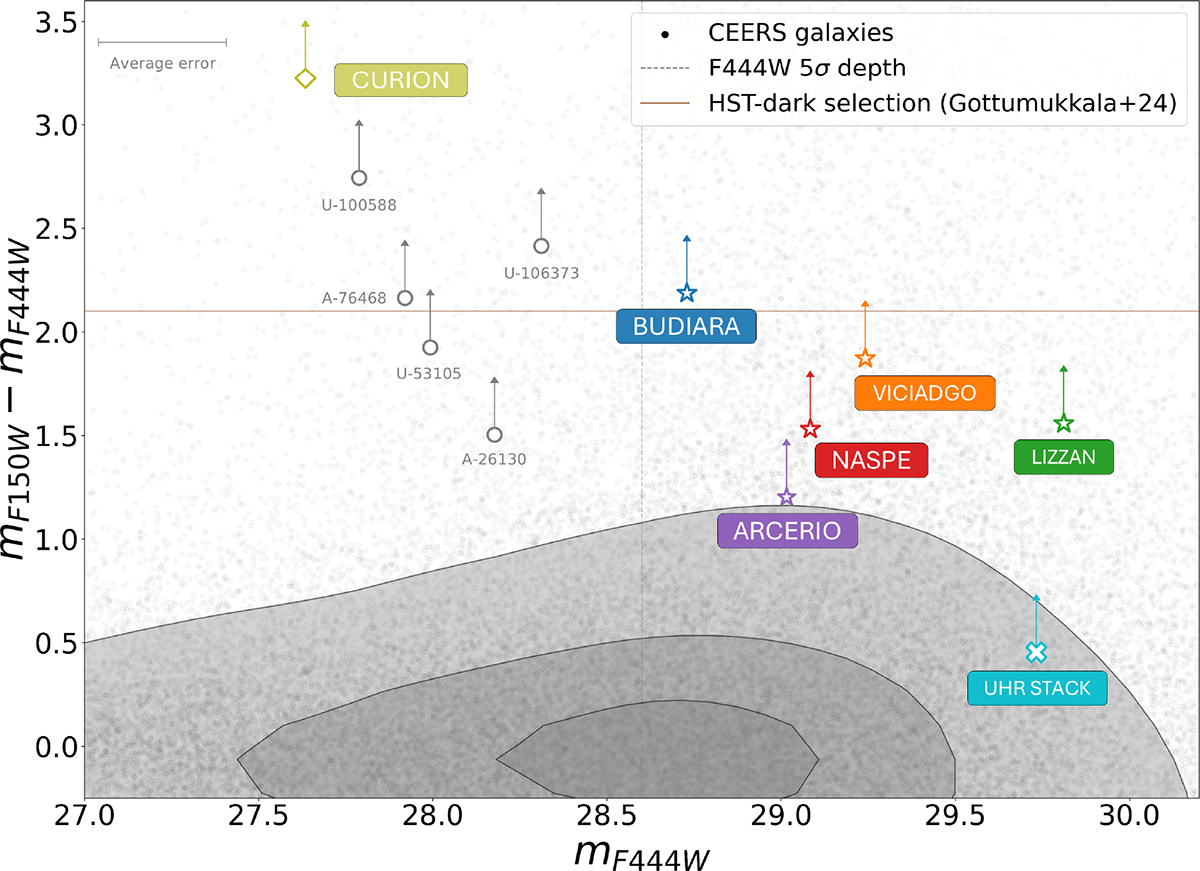
[F150W – F444W] color-magnitude diagram for our F200W dropouts. The F200W-dropout representation scheme is the same adopted in Fig. 3, as well as the F444W 5σ depth threshold and x axis average errors. In addition, the HST-dark galaxy selection technique from Gottumukkala et al. (2024) is represented by a continuous brown line.
Current usage metrics show cumulative count of Article Views (full-text article views including HTML views, PDF and ePub downloads, according to the available data) and Abstracts Views on Vision4Press platform.
Data correspond to usage on the plateform after 2015. The current usage metrics is available 48-96 hours after online publication and is updated daily on week days.
Initial download of the metrics may take a while.