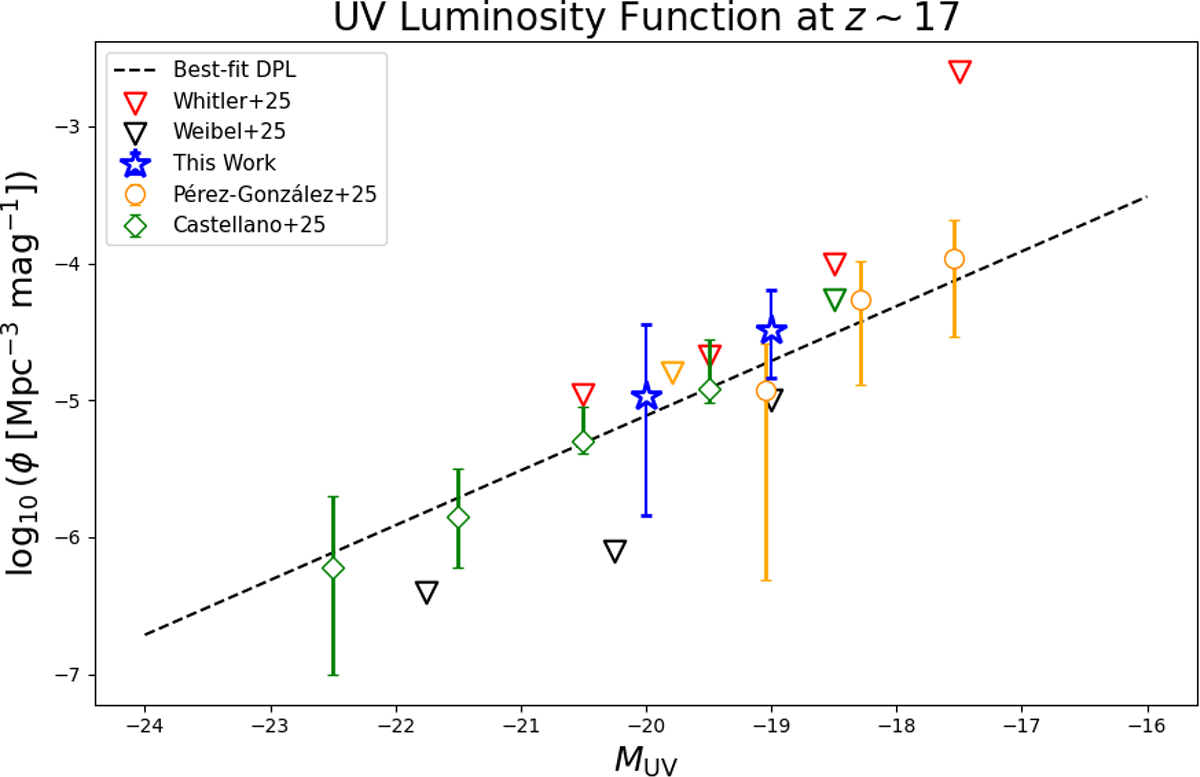
Fig. 6.
Download original image
UV luminosity function estimate from our work (blue stars), alongside estimates from Castellano et al. (2025, green diamonds), Pérez-González et al. (2025, yellow circles), Weibel et al. (2025, black triangles, representing upper limits), and Whitler et al. (2025, red triangles, again representing upper limits). The best-fit power law is represented as a dashed black line.
Current usage metrics show cumulative count of Article Views (full-text article views including HTML views, PDF and ePub downloads, according to the available data) and Abstracts Views on Vision4Press platform.
Data correspond to usage on the plateform after 2015. The current usage metrics is available 48-96 hours after online publication and is updated daily on week days.
Initial download of the metrics may take a while.