Fig. 3.
Download original image
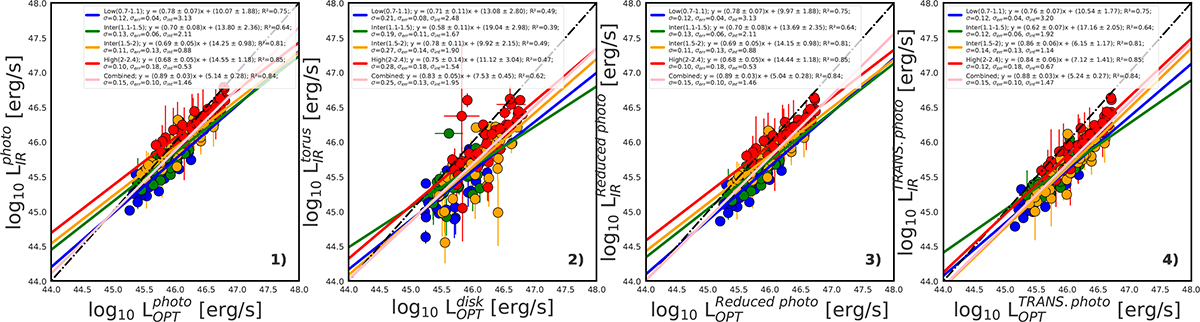
Transformation of the luminosity relation across redshifts for objects with ![]() [erg/s]. The first plot shows the relation between the photometric method estimated luminosities. The second plot shows the OPT-IR relation for CIGALE
[erg/s]. The first plot shows the relation between the photometric method estimated luminosities. The second plot shows the OPT-IR relation for CIGALE ![]() and
and ![]() . The third plot shows the
. The third plot shows the ![]() and
and ![]() with reduced contaminations, described in the Sect. 5.7. The fourth plot shows the transformed luminosities, described in Sect. 5.6.
with reduced contaminations, described in the Sect. 5.7. The fourth plot shows the transformed luminosities, described in Sect. 5.6.
Current usage metrics show cumulative count of Article Views (full-text article views including HTML views, PDF and ePub downloads, according to the available data) and Abstracts Views on Vision4Press platform.
Data correspond to usage on the plateform after 2015. The current usage metrics is available 48-96 hours after online publication and is updated daily on week days.
Initial download of the metrics may take a while.