Open Access
Fig. 5.
Download original image
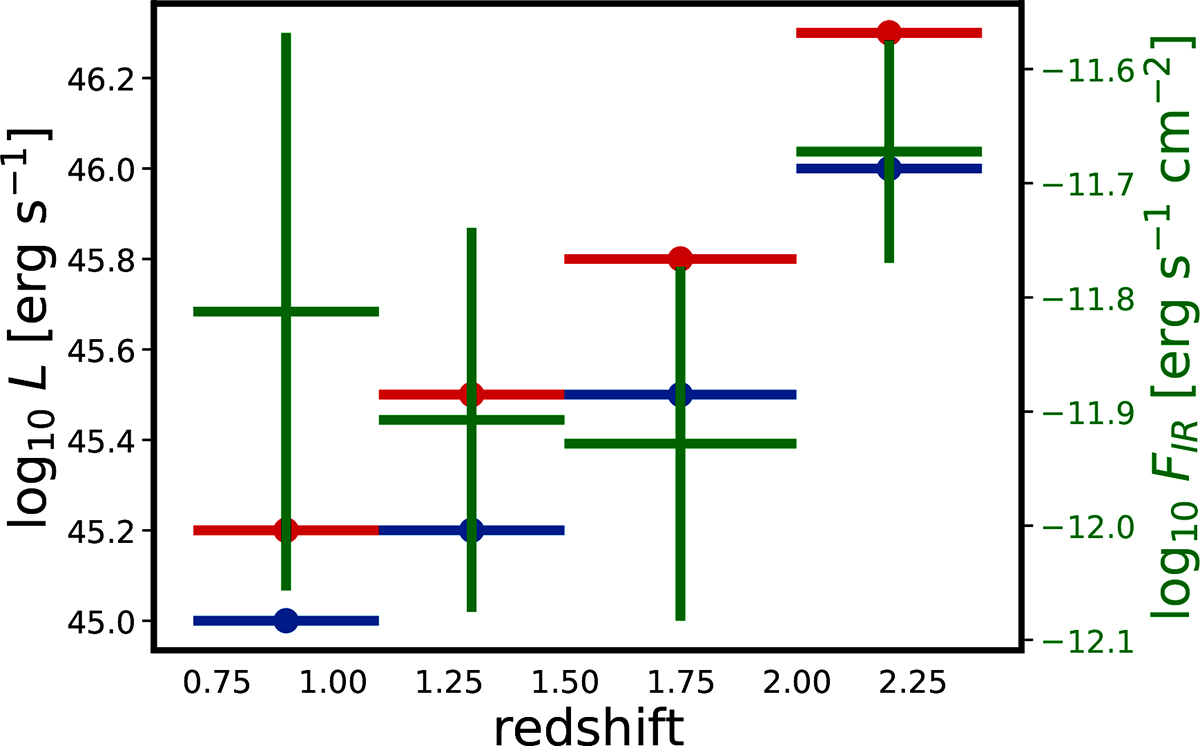
Transition luminosity above which the SED fit is dominated by the AGN components in the consecutive redshift bins. The red points show ![]() , which approximates the dusty torus, and the green points reveal the corresponding fluxes. The blue points visualize
, which approximates the dusty torus, and the green points reveal the corresponding fluxes. The blue points visualize ![]() , which correspond to the accretion disk.
, which correspond to the accretion disk.
Current usage metrics show cumulative count of Article Views (full-text article views including HTML views, PDF and ePub downloads, according to the available data) and Abstracts Views on Vision4Press platform.
Data correspond to usage on the plateform after 2015. The current usage metrics is available 48-96 hours after online publication and is updated daily on week days.
Initial download of the metrics may take a while.