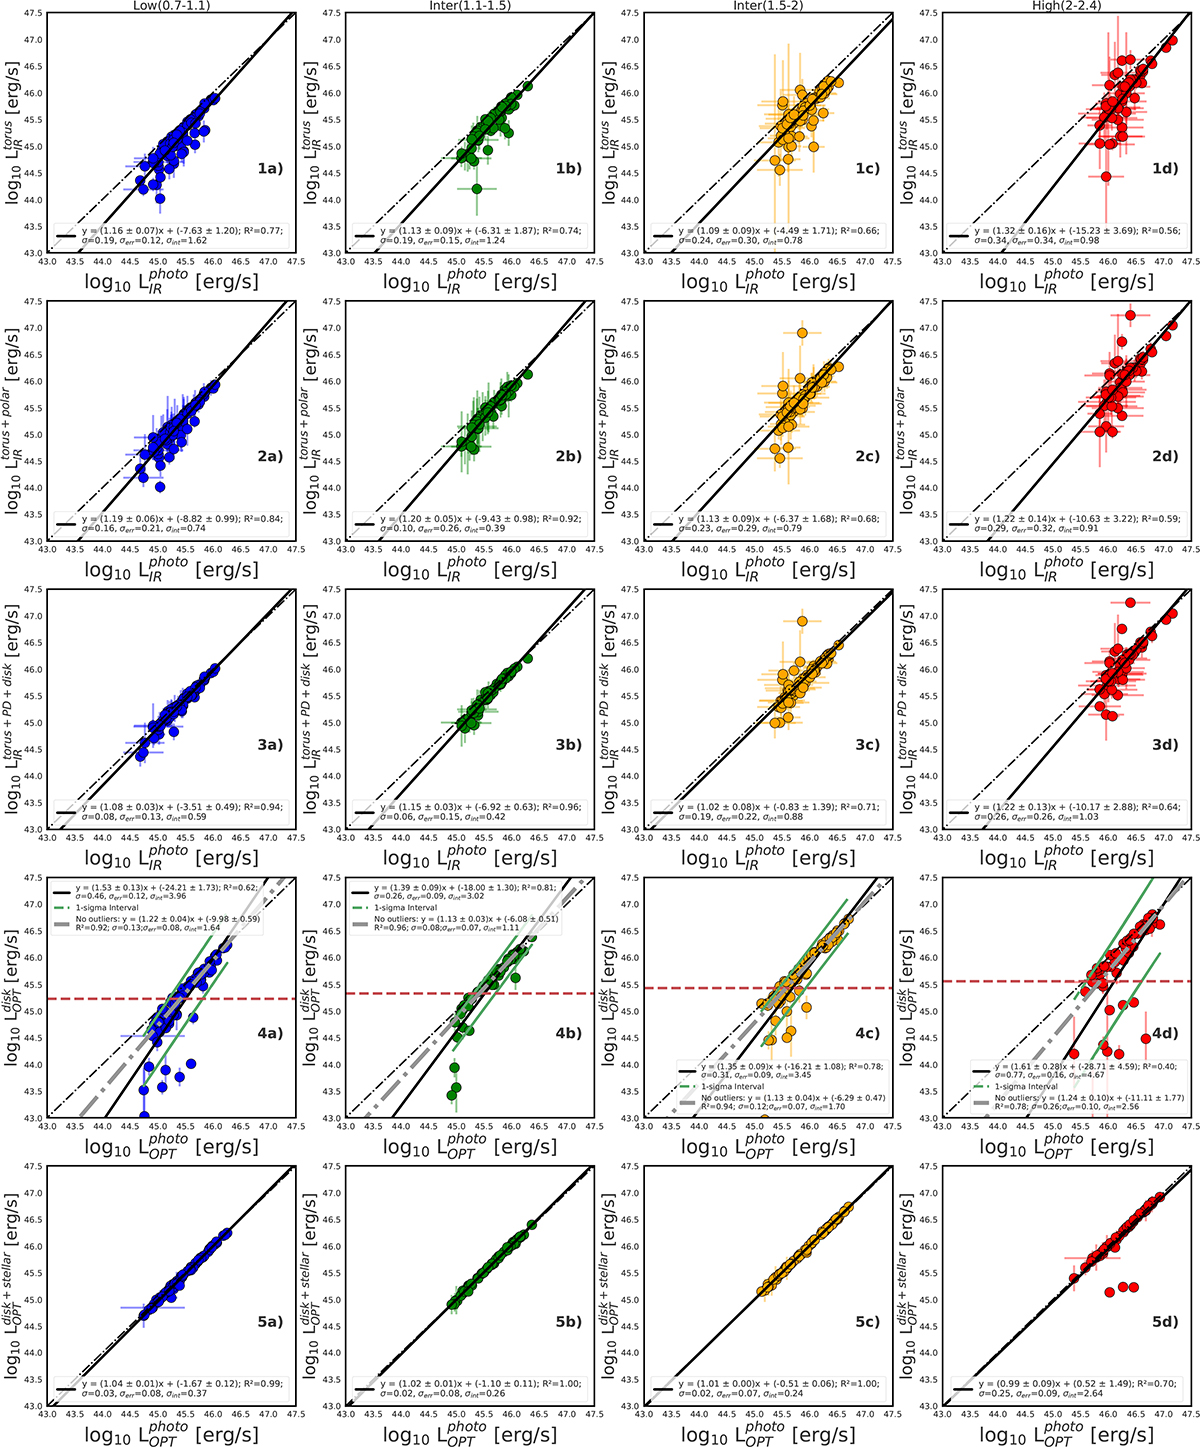
Fig. A.1.
Download original image
Comparison of luminosities estimated from 1) our photometric method (presented on X-axis) and 2) CIGALE estimates without and with contaminations for four redshift bins. The dashed line represents the 1:1 relation, while the solid black line corresponds to the best-fit ordinary least squares regression. In the fourth row, outliers were identified as objects lying below the 1σ threshold (indicated by green lines) and are marked with star symbols. These outliers were excluded, and a second ordinary least squares regression was fit to the remaining data points (dash-dot gray line). Additionally, in the fourth row, the dashed red line indicates the luminosity cut described in Sect. 4.2. The σ is the spread of the relation.
Current usage metrics show cumulative count of Article Views (full-text article views including HTML views, PDF and ePub downloads, according to the available data) and Abstracts Views on Vision4Press platform.
Data correspond to usage on the plateform after 2015. The current usage metrics is available 48-96 hours after online publication and is updated daily on week days.
Initial download of the metrics may take a while.