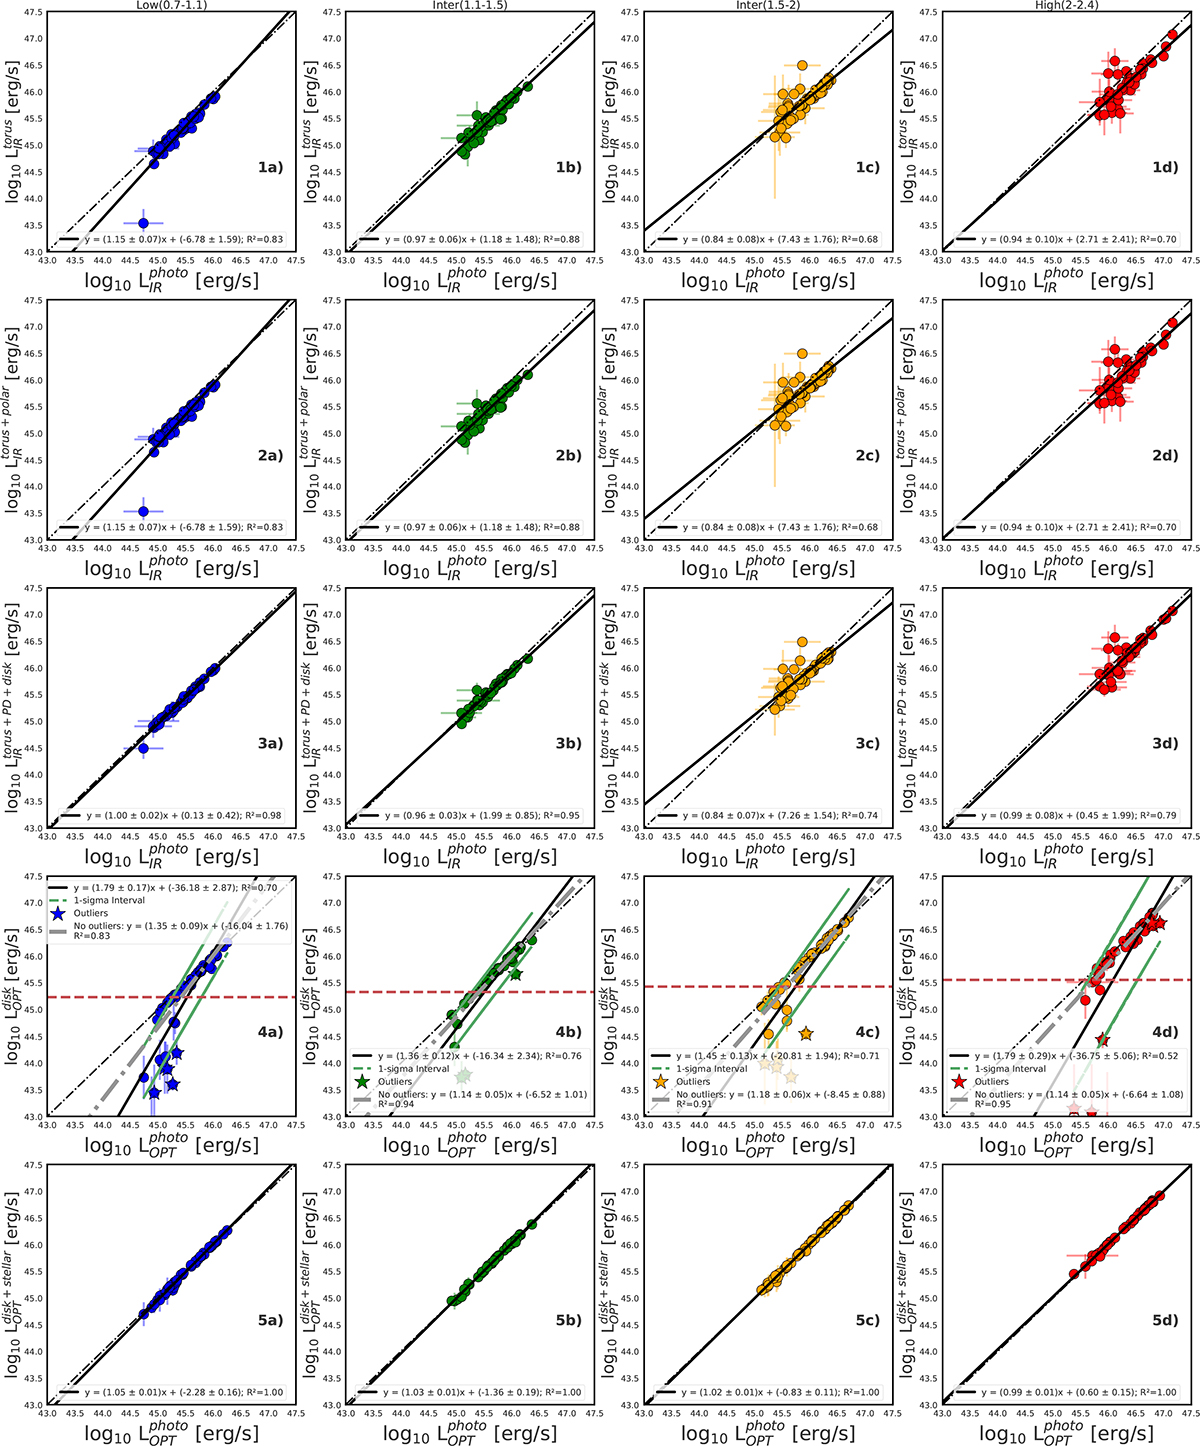
Fig. A.4.
Download original image
No PD: Comparison of luminosities estimated from 1) our photometric method (presented on X-axis) and 2) CIGALE estimates without and with contaminations for 4 redshift bins. The dashed lines is the 1:1 relation, while the solid black line is the best-fit regression. In the fourth row the outliers were also accounted for, defined as objects below 1σ error (green lines), marked with stars. Then the outliers were extracted and another regression was fit (dashed gray line).
Current usage metrics show cumulative count of Article Views (full-text article views including HTML views, PDF and ePub downloads, according to the available data) and Abstracts Views on Vision4Press platform.
Data correspond to usage on the plateform after 2015. The current usage metrics is available 48-96 hours after online publication and is updated daily on week days.
Initial download of the metrics may take a while.