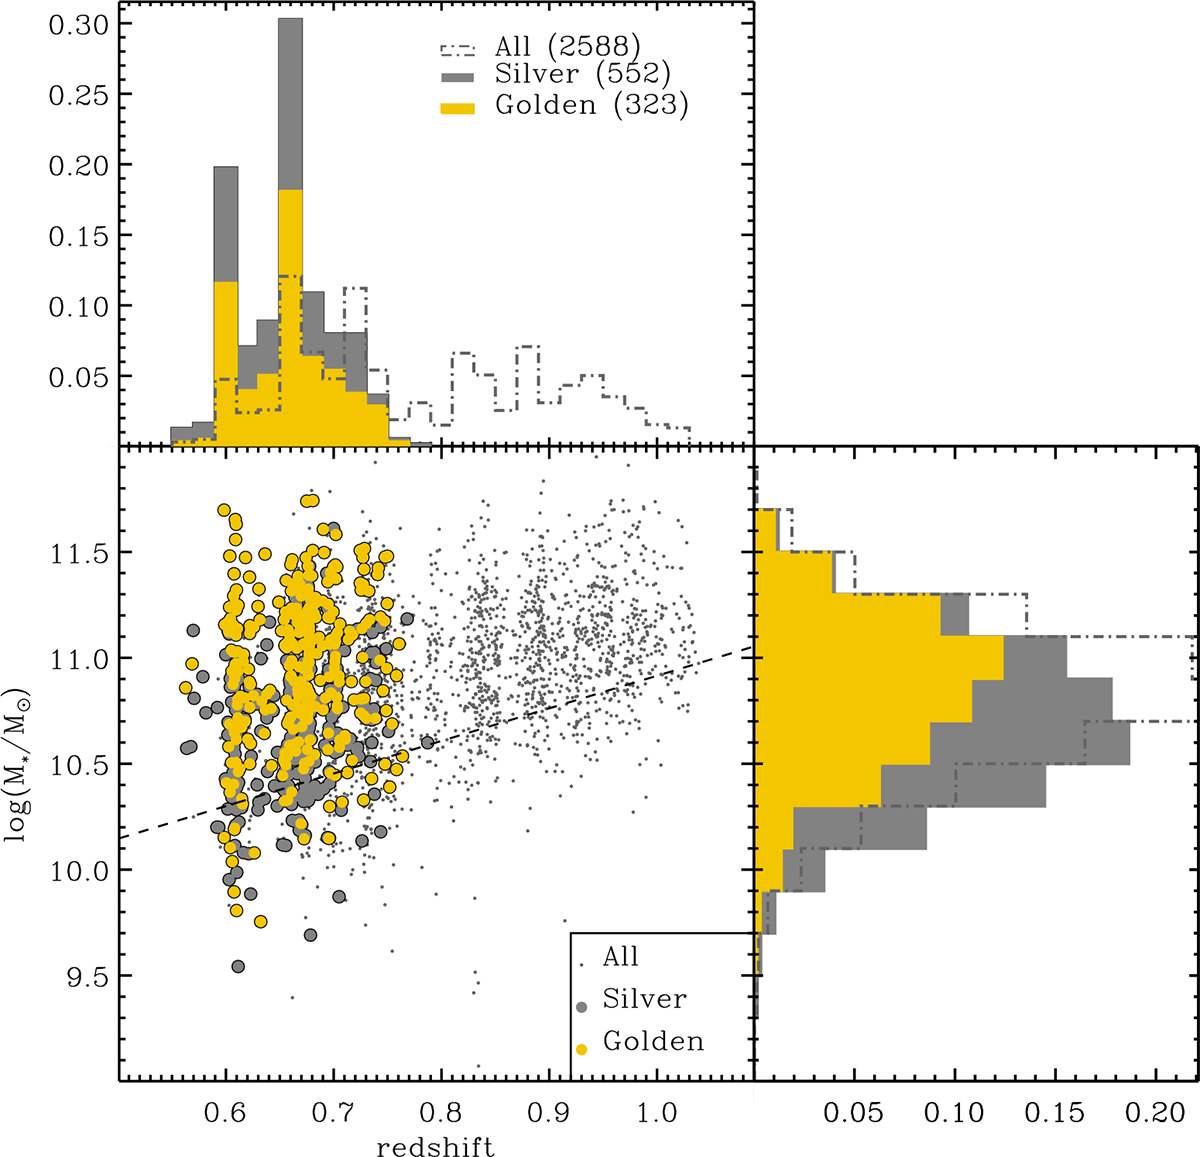
Fig. 1.
Download original image
Distribution in stellar mass and redshift for the LEGA-C primary sample (grey dots and dot-dashed histograms, normalised to unit integral) and for the sub-samples used in the analysis. The sub-samples are the silver sample (grey symbols and histograms) and the golden sample (golden symbols and histograms). The histograms for the silver and golden samples have been normalised by the number of galaxies in the silver sample. The number of galaxies in each sub-sample is given in parenthesis. Redshifts come from the LEGA-C DR3 catalogue, while stellar masses are those computed in this work.
Current usage metrics show cumulative count of Article Views (full-text article views including HTML views, PDF and ePub downloads, according to the available data) and Abstracts Views on Vision4Press platform.
Data correspond to usage on the plateform after 2015. The current usage metrics is available 48-96 hours after online publication and is updated daily on week days.
Initial download of the metrics may take a while.